Monitoring menu
You can access this menu by clicking your avatar and selecting Settings. By default this is only displayed for the Full Administrator role, or a role configured with the Security permission. Refer to Roles and Securables.
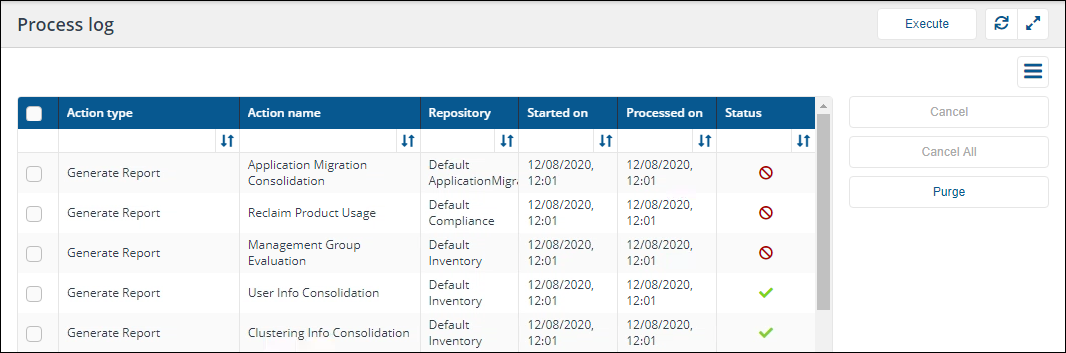
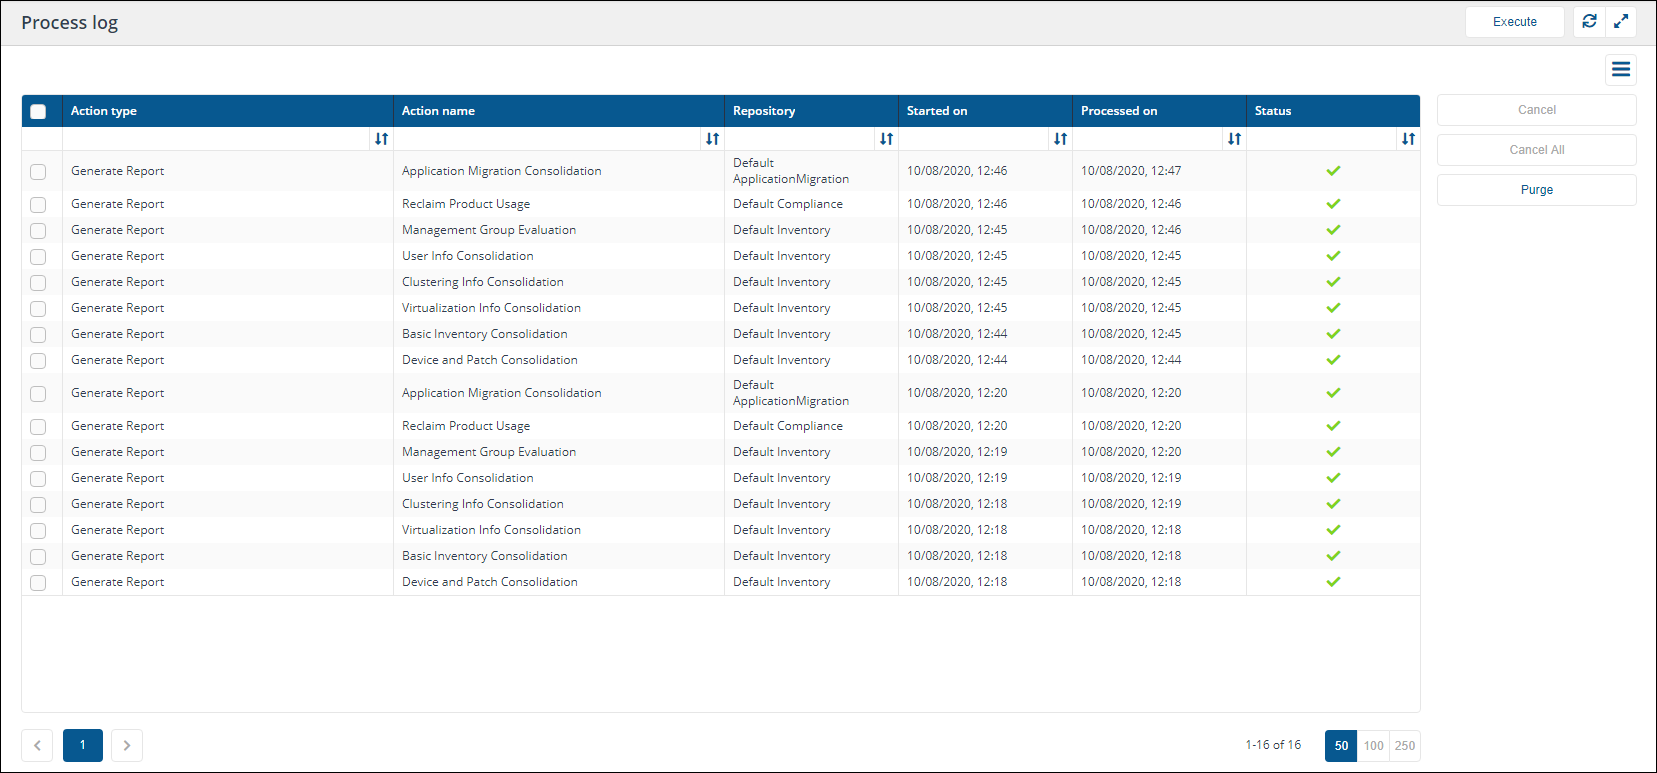
The Process log page lets you view the progress of queued actions, cancel actions that are pending and purge process log history.
The Process log table
|
Column |
Description |
|---|---|
|
Action type |
The type of action queued. For example CleanSync and Sync Data might be two actions executed when executing an overall connector sync data action. |
|
Action name |
The name of the action being executed. For example CleanSync - SCCM and Sync Data - SCCM might be two actions executed when executing an overall Configuration Manager sync data action. |
|
Repository |
The name of the repository (if any) the action is being performed on. For example Default Inventory. |
|
Started on |
The date and time the action started. |
|
Processed on |
The date and time the action finished. |
|
Status |
This indicates the current state for the action and ultimately whether it succeeded, failed or was canceled. This may be one of the following:
|
 The action is in progress.
 The action is queued.
Execute an action
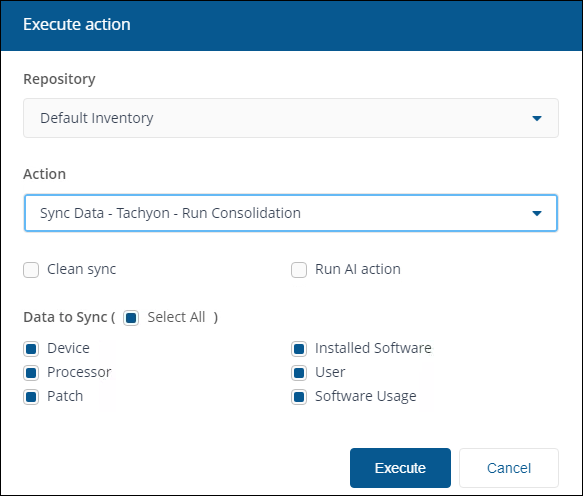
The Execute button allows you to manually run an action.
To schedule an action, please refer to Schedules page.
-
Click Execute.
-
In the Execute action pop-up subsequently displayed, use the Repository menu to select the inventory repository you want to populate.
-
Once the repository has been selected you can then select the action to run. In the case of inventory repositories the actions will be restricted to inventory related actions. For a connector you will be looking for an action with the form Sync Data - <connector name>.
-
For inventory syncs (where you sync a connector) you have additional options to check.
Warning
Clean Sync causes deletion of existing data previously imported by the selected combination of action and repository. Data imported by any other connector actions is left intact and consolidated with new data.
To clear all data from a repository, refer to Clearing data from a repository.
If Clean Sync checkbox is not checked then an incremental sync occurs, consolidating new data with old. An incremental sync is quicker than a clean sync.
Clean Sync will prevent the Management Groups feature and applications such as Patch Success from working until the sync is complete and new data has been consolidated. This operation should only be performed if you need a clean sync or are experiencing problems with sync times taking too long.
Run AI action will cause the AI action to run, this is only available if AI Powered Auto-curation has been enabled. The Run AI action checkbox is also available if the selected Action is Generate Report - Basic Inventory Consolidation.
For details on how to enable AI Powered Auto-curation the information is on the AI Powered Auto-curation page.
Data to Sync allows you to select some or all categories of data supported by the connector.
-
Click Execute in the Execute action pop-up to start the sync.
-
A pop-up appears momentarily informing you that the Sync has started and you can monitor progress in the Process log.
-
When the sync starts a number of actions are queued to be performed on the selected repository. To check the progress of the sync actions:
-
Navigate to the Monitoring > Process log page.
-
Here you can see the sequence of actions that have been queued for the selected repository related to the Sync Data action selected.
-
When each action has finished running you'll see a check icon
 appear in the Status column if it succeeds or a failed icon
  if it fails.
-
-
Once all the actions have succeeded you can check the results. To do this:
-
Navigate to the Monitoring > Sync log page.
-
This displays the items that have been added to the selected repository as a result of running the sync.
-
Canceling actions
You can use Cancel to cancel individual actions or Cancel All to cancel all running or stuck actions.
Only Full Administrators have permission to use the Cancel All and Purge buttons.
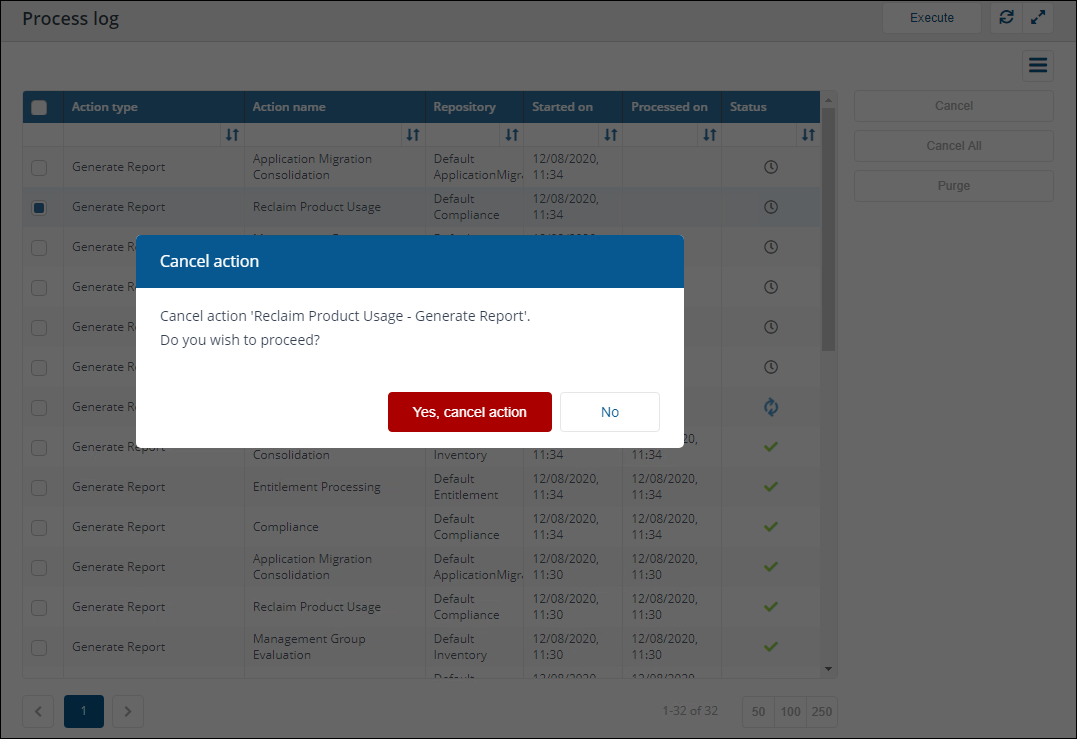
The Cancel button is used to cancel multiple or individual pending queued actions, you can do this by:
-
Select the queued
 action(s) you want to cancel from the Process log table by checking the box at the left-hand end of each action's row.
 -
If any of the selected actions is queued Cancel will be enabled.
-
Click Cancel.
-
The Cancel actions pop-up asks if you want to proceed.
-
To proceed and cancel the selected queued actions click Yes, cancel actions.
-
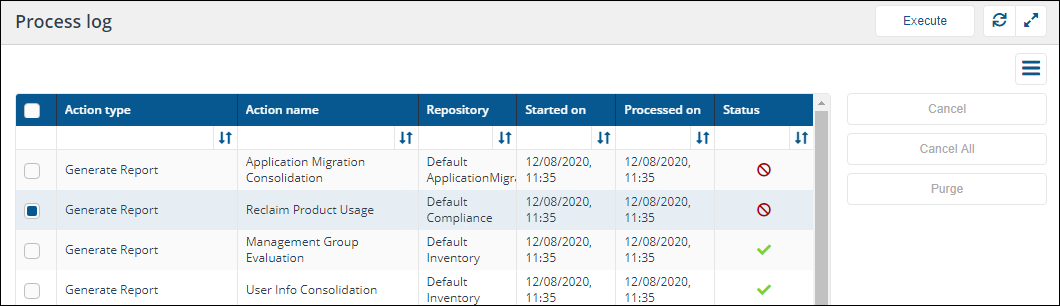
The actions will not longer be run and the status of the selected queued actions will change to canceled
 .
.
When one action is selected, all the dependent actions are also canceled.
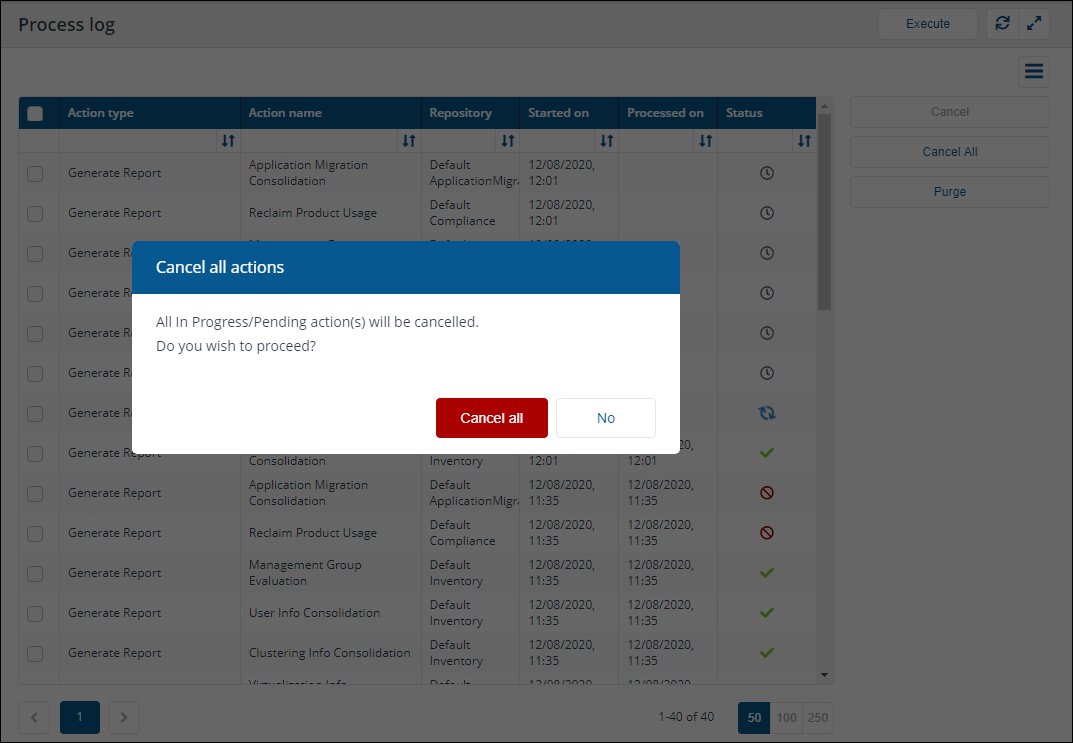
The Cancel All button can be used to cancel all currently running or stuck actions. You do not need to select an individual action before doing this. You'll see a warning message if Cancel All is clicked, then all actions will be cancelled.
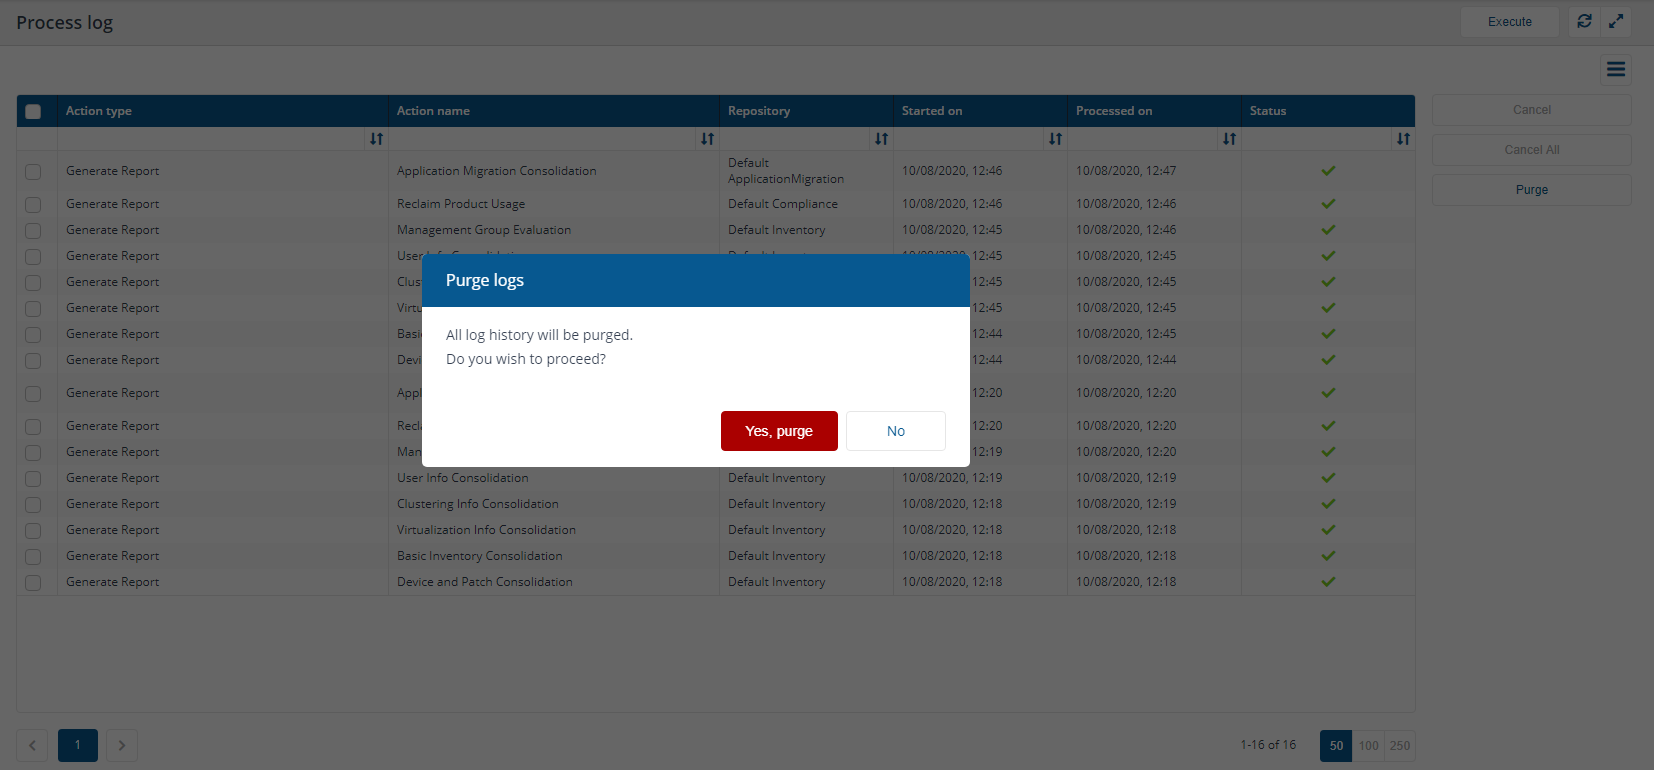
Purge logs
You can purge the entire Process Log history by:
-
Clicking the Purge button.
-
The Purge logs pop-up asks if you want to proceed.
-
To proceed and purge the logs, click the Yes, purge button.
-
The Process log is then purged of all items.
If any Action type items are selected the Purge button will be disabled.
Only Full Administrators have permission to use the Cancel All and Purge buttons.
The Provider log page lets you view status log events related to 1E Provider operations.
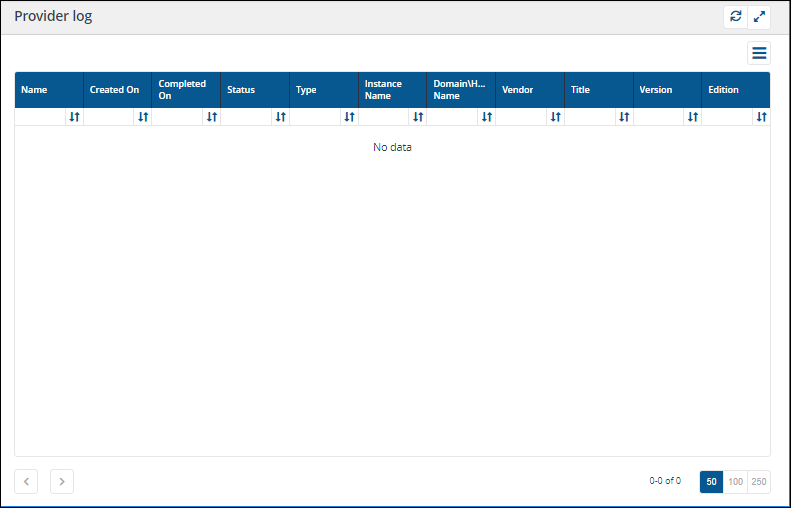
The columns in the Provider log are described in the following table:
|
Column |
Description |
||||||||||||||
|---|---|---|---|---|---|---|---|---|---|---|---|---|---|---|---|
|
Name |
Shows the source of the Provider operation. |
||||||||||||||
|
Created On |
The date the Provider operation was created. |
||||||||||||||
|
Completed On |
The date the Provider operation completed. |
||||||||||||||
|
Status |
The current status of the Provider operation.
|
||||||||||||||
|
Type |
The operation type. |
||||||||||||||
|
Instance Name |
The repository name where the Provider operation was created. |
||||||||||||||
|
Domain\Host Name |
The domain and device name where the Provider operation is run. |
||||||||||||||
|
Vendor |
The Vendor details for Product related Provider operations. |
||||||||||||||
|
Title |
The Title details for Product related Provider operations. |
||||||||||||||
|
Version |
The Version details for Product related Provider operations. |
||||||||||||||
|
Edition |
The Edition details for Product related Provider operations. |
The Sync log page lets you review the records that have been added to repositories as a result of syncing connectors.
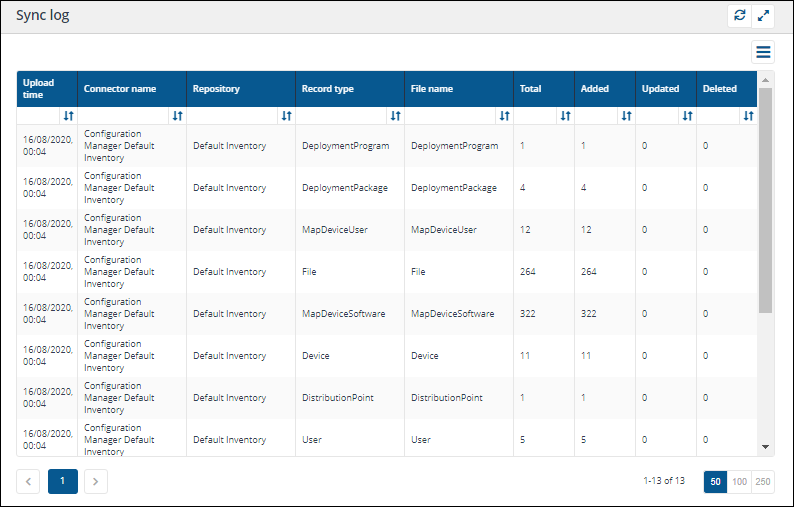
The Sync log table displays a list of records that have been uploaded to repositories by connectors. The columns displayed are described in the following table:
|
Column |
Description |
|---|---|
|
Upload time |
The date and time the specific record type was uploaded. |
|
Connector name |
The name of the connector that uploaded the record type. |
|
Repository |
The name of the repository the record type was uploaded to. |
|
Record type |
The type of record uploaded. |
|
File name |
The file name created internally for this record type. |
|
Total |
The total number of records related to this record type sourced during the synchronization event. |
|
Added |
The number of records added to the platform for this record type. |
|
Updated |
The number of records that were updated as a result of uploading the record type. |
|
Deleted |
The number of records that were removed as a result of uploading the record type. |
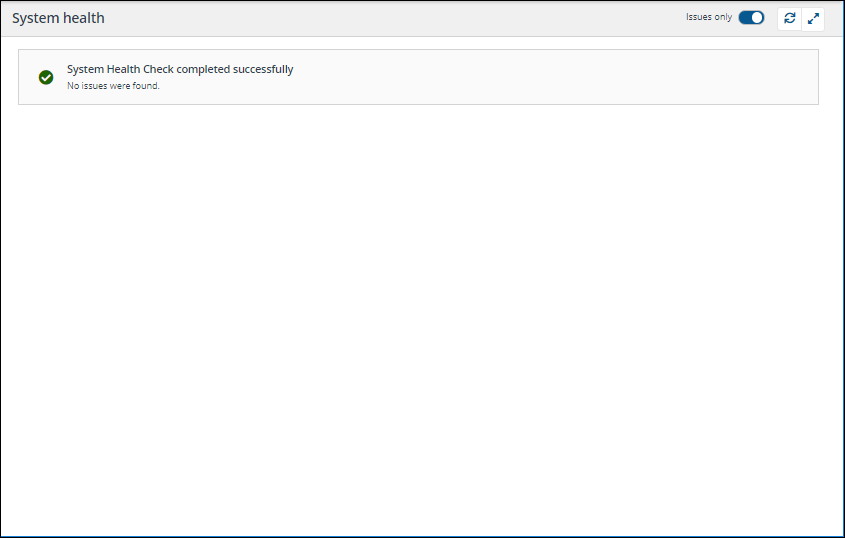
The System Health page runs a comprehensive series of component checks. By default, it shows issues, but you can see a full list of green lights by toggling Issues only.
Looking at the health checks
Showing all the checks
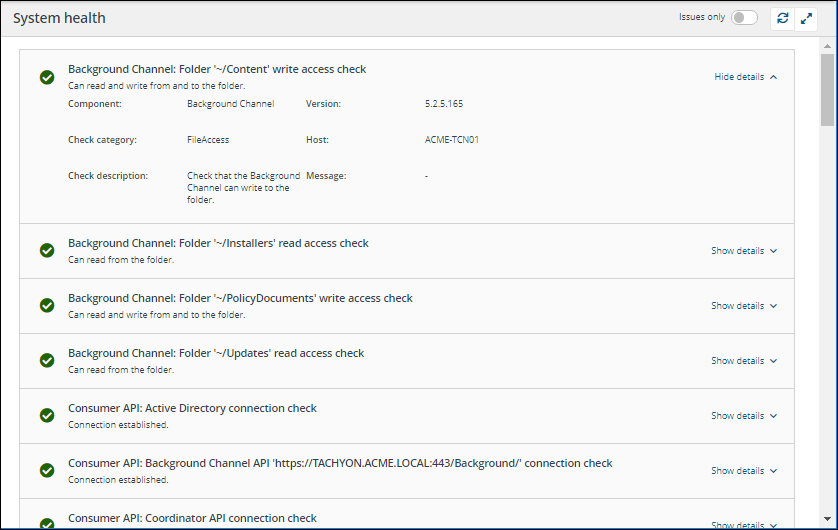
By default, the System health page shows only the checks where issues have been identified, unless there are no issues, in which case it displays an all clear message. You can set the page to show all the checks by toggling the Issues only switch to off in the banner for the page. The picture shows this and the types of check that will be subsequently displayed.
Showing the check details
You can also expand each check to view the details related to it by clicking on the Show details link at the top-right of the check's entry in the System health table. The picture shows the Background Channel Folder write access check expanded.
When expanded you can see the following information for each check:
|
Information |
Description |
|---|---|
|
Component |
The name for the component. |
|
Version |
The component version number. |
|
Check category |
The category the check belongs to. |
|
Host |
The host device the component is running on. |
|
Check description |
The description for the check being made. |
|
Message |
Any messages that have been generated by running the check. |
You will see four SLA Integrate errors after installation, which will disappear after you have installed a Connector.
The health checks
The following table provides an overview of all the health checks made by Tachyon:
|
Component |
Check |
Description |
|---|---|---|
|
Background Channel |
Folder '~/Content' write access check |
Check that the Background Channel can write to the "Content" folder within the app pool user context. |
|
Folder '~/Installers' read access check |
Check that the Background Channel can read from the "Installers" folder within the app pool user context. |
|
|
|
Folder '~/Policy Documents' write access check |
Check that the Background Channel can write to the "PolicyDocuments" folder within the app pool user context. |
|
|
Folder '~/Updates' read access check |
Check that the Background Channel can read from the "Updates" folder within the app pool user context. |
|
Consumer API |
Active Directory connection check |
Check that Consumer API can connect to Active Directory. Uses the configured GC or LDAP connection string. |
|
|
Background Channel API connection check(s) |
Check that Consumer API can connect to Background Channel API. Uses the URL(s) stored in the TachyonMaster database. |
|
|
Coordinator API connection check |
Check that Consumer API can connect to Coordinator API. Uses the OperationalSafeGuardsUrl application setting. |
|
|
Core API '<Core server>' connection check(s) |
Check that Consumer API can connect to Core API. Uses the URL(s) stored in the TachyonMaster database. |
|
|
TachyonMaster database connection check |
Check that Consumer API can connect to the TachyonMaster database. Uses the configured connection string (TachyonMaster) within the app pool user context. |
|
|
TachyonResponse database connection check(s) |
Check that Consumer API can connect to the TachyonResponse database(s). Uses the stored connection strings within the TachyonMaster database under the app pool user context. |
|
Coordinator service Agent Deployment module |
Background Channel API connection check |
Check that Coordinator Agent Deployment module can connect to Background Channel API. Uses the URL(s) stored in the TachyonMaster database. |
|
Coordinator service Licensing module |
Check license service URL |
Verify that license service URL is from a trusted issuer. |
|
|
Check license validity |
Verify license expiry date. |
|
|
Check trust with licensing component |
Verify trust between coordinator and licensing component by comparing signatures between the licensing module DLL and licensing DLL. |
|
Coordinator service Management Groups module |
Management Group API connection check |
Check that Coordinator Management Groups module can connect to SLA Management Group API using the configured URL. Uses the SLAEndpoint module setting. |
|
Coordinator service Policy module |
Background Channel API connection check |
Check that Coordinator Policy Module can connect to Background Channel API. Uses the URL(s) stored in the TachyonMaster database. |
|
Coordinator service |
Active Directory connection check |
Check that Coordinator can connect to Active Directory. Uses the configured GC or LDAP connection string. |
|
|
Coordinator certificate check |
Check that Coordinator has a valid certificate used for the SSL API communication. |
|
|
SMTP connection check |
Check that Coordinator can connect to the SMTP server using the "EHLO" command. Only shown if SMTP emails has been enabled. |
|
|
TachyonMaster database connection check |
Check that Coordinator can connect to the TachyonMaster database. Uses the configured connection string (TachyonMaster) within the app pool user context. |
|
|
Website application authentication check |
Check that Consumer API site has Windows authentication enabled and that Anonymous authentication is disabled. |
|
|
Website certificate binding check |
Check that Consumer API has a valid certificate binding. |
|
Core |
TachyonMaster database connection check |
Check that Core can connect to TachyonMaster database. Uses the configured connection string (TachyonMaster) within the app pool user context. |
|
|
TachyonResponse database connection check(s) |
Check that Core can connect to TachyonResponse database(s). Uses the stored connection strings within the TachyonMaster database under the app pool user context. |
|
SLA Admin |
Consumer API connection check |
Check that SLA Admin can connect to the Consumer API. Uses the PermissionCheckerRootUrl application setting. |
|
|
SLA Platform API connection check |
Check that SLA Admin can connect to the SLA Platform API. |
|
|
SLA-Data database connection check |
Check that SLA Admin can connect to the SLA-Data database. Uses the configured connection string (DefaultCustomerConnection) within the app pool user context. |
|
|
SLA-Shared database connection check |
Check that SLA Admin can connect to the SLA-Shared database. Uses the configured connection string (DefaultSharedConnection) within the app pool user context. |
|
SLA Engine |
1ECatalog database connection check |
Check that SLA Engine can connect to the 1ECatalog database. Uses the BaseUri application setting to request the 1ECatalog connection string from the SLA Platform API. The database connection check is performed within the service user context. |
|
|
Catalog API connection check |
Check that SLA Engine can connect to the Catalog API. Uses the URL retrieved from the SLA-Data.Component table for 1ECatalog within the service user context. |
|
|
Consumer API connection check |
Check that SLA Engine can connect to the Consumer API. Uses the TachyonConsumerRootUrl application setting. |
|
|
SLA Platform API connection check |
Check that SLA Engine can connect to the SLA Platform API. Uses the BaseUri application setting. |
|
|
SLA-Data database connection check |
Check that SLA Engine can connect to the SLA-Data database. Uses the configured connection string (DefaultCustomerConnection) within the service user context. |
|
|
SLA-Shared database connection check |
Check that SLA Engine can connect to the SLA-Shared database. Uses the configured connection string (DefaultSharedConnection) within the service user context. |
|
SLA Integrate Agent service (part of SLA Integrate services) |
Folder '<ConnectorsRoot>' write access check |
Check the SLA Integrate Agent can write to the 'dir-connectors' folder within the service user context. |
|
|
Folder '<InstallerRoot>' write access check |
Check the SLA Integrate Agent can write to the 'dir-job-output' folder within the service user context. |
|
|
Folder '<JobOutputRoot>' write access check |
Check the SLA Integrate Agent can write to the 'dir-job-output' folder within the service user context. |
|
|
SLA Integrate Manager connection check |
Check that the SLA Integrate Agent can connect to the SLA Integrate Manager. Uses the rest-api-address application setting. |
|
|
SLA Platform API connection check |
Check that the SLA Integrate Agent can connect to the SLA Platform API. Uses the rest-api-address application setting to request the SLA Platform API address from the SLA Integrate Manager. |
|
SLA Integrate Manager service (part of SLA Integrate services) |
Folder '<InstallerRoot>' write access check |
Check the SLA Platform Integrate Manager can write to the 'dir-installers' folder within the service user context. |
|
|
Folder '<JobOutputRoot>' write access check |
Check the SLA Platform Integrate Manager can write to the 'dir-job-output' folder within the service user context. |
|
|
SLA Platform API connection check |
Check that SLA Integrate Manager can connect to the SLA Platform API. Uses the sla-data-address application setting. |
|
|
SLA-Integrate database connection check |
Check the SLA Integrate Manager service can connect to the SLA-Integrate database. Uses the configured connection string (default) within the service user context. |
|
|
SLA Platform Integrate Agent |
Check at least one SLA Platform Integrate Agent has reporting health status. |
|
SLA Platform API API includes the UI The following are not checked:
|
1ECatalog database connection check |
Check that SLA Platform API can connect to the 1ECatalog database. Uses the configured connection string (DefaultCatalogConnection) within the app pool user context. |
|
|
Consumer API connection check |
Check that SLA Platform API can connect to Consumer API. Uses the PermissionCheckerRootUrl application setting. |
|
|
SLA-Data database connection check |
Check that SLA Platform API can connect to the SLA-Data database. Uses the configured connection string (DefaultCustomerConnection) within the app pool user context. |
|
|
SLA-Shared database connection check |
Check that SLA Platform API can connect to the SLA-Shared database. Uses the configured connection string (DefaultSharedConnection) within the app pool user context. |
|
|
SLA Engine |
Check the SLA Engine has reported health status. |
|
Switch Switch Host is not checked |
Core Connect (Device) |
Check if this Switch can connect to core Device endpoint. |
|
|
Core Connect (Instructions) |
Check if this Switch can connect to core Instructions endpoint. |
|
|
Core Connect (Policy Response) |
Check if this Switch can connect to core Policy Response endpoint. |
|
|
Core Connect (Policy) |
Check if this Switch can connect to core Policy endpoint. |
|
|
Core Connect (Response) |
Check if this Switch can connect to core Response endpoint. |
|
|
Core Connect (Switch) |
Check if this Switch can connect to core Switch endpoint. |
|
|
Recent administrative events. |
Check if this Switch has had any recent errors or warnings (since last instruction poke) |
The Infrastructure log page lets you view status log events related to the 1E infrastructure.
|
Column |
Description |
|---|---|
|
Type |
Shows the type of event being logged. For example a Workflow event. |
|
Sub type |
Shows the sub type (if any) for more general type events. For example Email Notification is a sub type of a Workflow event. |
|
Description |
The description of the event. For example Failure sending mail. Unable to connect to the remote server No connection could be made because the target machine actively refused it shows a workflow event cause by a failure to connect to the specified mail server. |
|
Date created |
The date the event was created. |
The Audit information log page lets you view information on who is using 1E what actions they are performing.
|
Column |
Description |
|---|---|
|
Type |
The type of event. For example Instruction Onboarding events let you know who has been loading instructions into 1E. |
|
Description |
Description of the actual event that occurred. For example Instruction definitions added to Instruction set 'Verification' lets you know that some instructions were added to a particular instruction set. |
|
User |
The user who performed the action being logged. For example ACME\TCNInstaller01 identifies the user who added instruction definitions to an instruction set. |
|
Date created |
The date and time the logged action occurred. |
|
Detail message |
Clicking the |
