Overview and Reports pages
How to use Endpoint Automation to ensure endpoint compliance to enterprise IT policies.
Endpoint Automation Overview page
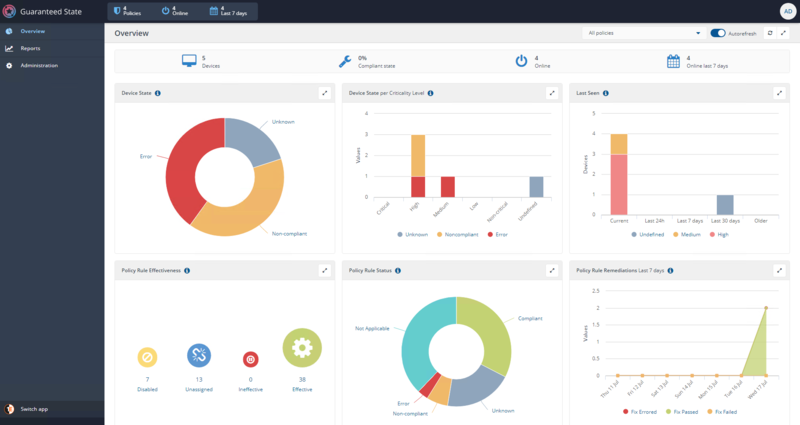
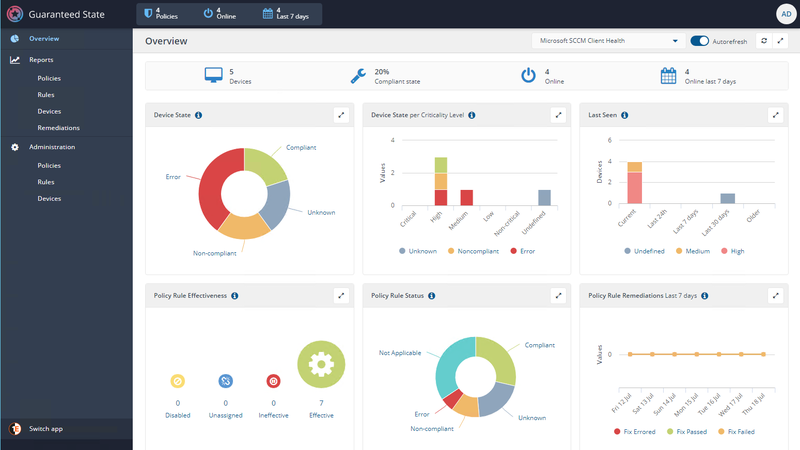
The overview page shows a dashboard with six charts, reflecting the currently selected policy or all policies.
The dashboard is refreshed (recalculated) when:
-
Opened or the page is refreshed in the browser.
-
A different policy is selected.
-
Autorefreshed when the Autorefresh switch is enabled.
-
The refresh button is clicked.
Dashboard charts overview
The Endpoint Automation dashboard presents a number of panels:
-
Overview header pane.
-
Device State.
-
Device State per Criticality Level.
-
Last Seen.
-
Rule Effectiveness.
-
Rule Status.
-
Policy Rule Remediations Last 7 days.
Overview header pane
The Overview header pane has three rows:
Top row:
-
Policies: Shows the number of policies currently enabled, and is a shortcut to the Policies administration pane.
-
Online: Shows the number of devices currently online, and is a shortcut to the Devices administration pane.
-
Last 7 days: Shows the number of devices seen in the last 7 days, and is a shortcut to the Devices administration pane.
Middle row:
-
Policies drop-down list: Filter on all policies or an individual policy, for example a selection of the Microsoft SCCM Client Health policy displays a filtered overview.
-
Autorefresh: Toggle switch.
-
A refresh button.
-
A resize button to display the central panes with and without the Endpoint Automation border panes.
Bottom row:
-
Devices: Shows the number of devices targeted by the selected policy, and is a shortcut to the Devices report pane.
-
Compliance state: Percentage of devices compliant with the selected policy filter - shortcut to the Devices report filtered on State is Compliant.
-
Online: Number of devices online - Shortcut to the Devices report filtered on LastSeen is current.
-
Online the last 7 days: Shortcut to Devices Report filtered on LastSeen is current OR LastSeenis 24h or LastSeen is 7 days.
Device State
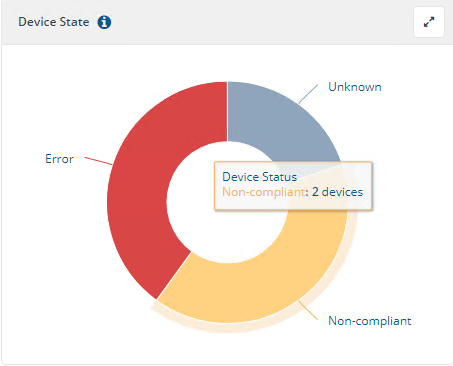
The state of devices whereEndpoint Automation policies have been deployed is represented in this form.
The user has the ability to drill down into the percentage of failures for each group of device states. For example, where the meaning of device states and their precedence is as follows:
|
State |
Description |
|---|---|
|
Unknown |
The device has yet to receive, evaluate or report back on its compliance state for at least one rule. |
|
Error |
The device has failed to evaluate at least one deployed rule. For example a device may report 97% of deployed rules as Not Applicable, but since 3% of the deployed rules reported as Error this means the whole Device State is marked as Error. |
|
Not Applicable |
At least one rule deployed to the device is not applicable. For example, this would occur if a Windows specific rule was deployed to a non-Windows device. |
|
Non-compliant |
At least one rule deployed to the device failed compliance checks. For example in the example above 86% of policy rules are compliant for the high-lighted device, but since 8% of the rules are Non-compliant the state of the whole device is marked as Non-compliant. |
|
Compliant |
The device passed compliance checks for every deployed policy rule. |
The drill down navigates to the Devices report filtered on the selected Device State such as Noncompliant.
Device State per Criticality Level
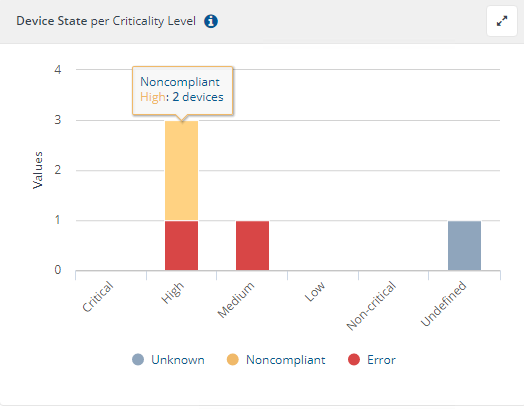
This pane presents a breakdown of the number of devices reporting against each compliance state against the device criticality groups.
The drill down navigates to the Devices report filtered by Device State and Criticality Level, such as State is Noncompliant AND Criticality is High.
Last Seen
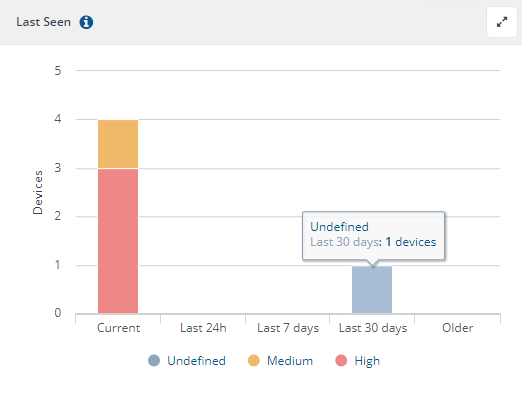
This panel shows a summary of when devices last made contact with the 1E server, grouped by the criticality level assigned to each device.
The drill down navigates to the Devices report filtered by LastSeen and criticality, such as LastSeen is Current AND Criticality is High.
Policy Rule Effectiveness
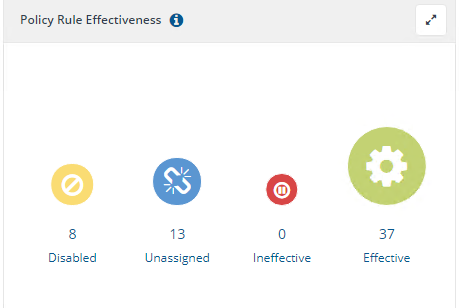
Policy rule effectiveness is the usefulness of policy rules and is represented as follows:
|
State |
Description |
|---|---|
|
Disabled |
The rule has not yet been enabled from the Endpoint Automation Rule Administration page, so it is not currently active. |
|
Unassigned |
The rule is enabled, but has not been deployed to any devices. To deploy a rule : The rule must be included in at least one policy. That policy must be assigned to a Management Group containing at least one device. The policy must be deployed. |
|
Ineffective |
The rule has been deployed, but no devices have changed their compliance position for this rule in the last thirty days. (The thirty day limit is received from the EffectiveThresholdDays row within the SQL TachyonMaster GlobalSetting table). |
|
Effective |
The rule has been deployed and at least one device has changed its compliance position for this rule in the last thirty days. (The thirty day limit is received from the EffectiveThresholdDays row within the SQL TachyonMaster GlobalSetting table). Effective plus Ineffective gives the total number of Policy Rules deployed. |
The drill down navigates to the Rules report filtered by Effectiveness, such as Effectiveness is Effective.
Policy Rule Status
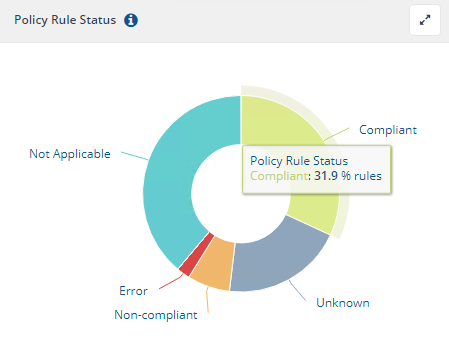
A user has the ability to drill down into a segment, for example, to examine exactly which policy rules reported failures across all the devices for which it was deployed.
In the above example, 37 rules were deployed to a representative sample of 5 devices across the IT estate. This gives 185 policy rule deployments of which 59 rule deployments reported Compliance giving an overall Policy Rule compliance of 31.9%.
|
State |
Description |
|---|---|
|
Compliant |
The proportion of policy rule deployments for which devices reported compliance. |
|
Non-compliant |
The proportion of policy rule deployments for which devices reported non-compliance. |
|
Error |
The proportion of policy rule deployments for which devices reported rule evaluation failure. |
|
Not Applicable |
The proportion of policy rule deployments for which devices reported not applicable. Typically, this would occur for devices to which a deployed rule was applicable only for a different platform, such as deploying Windows Client Health policy rules to macOS devices. |
|
Unknown |
The proportion of policy rule deployments for which devices have yet to receive, evaluate or report back on their compliance position. In the example above 20% of the policy rule deployments report as Unknown because one of the five devices to which policies have been deployed has remained offline for several days. |
After the hotfix:
|
State |
Description |
|---|---|
|
Compliant |
Rule check passed. |
|
Non-compliant |
Rule check failed. |
|
Error |
Rule could not evaluate its precondition, triggers, check or fix. |
|
Not Applicable |
Rule precondition did not pass. Typically, this would occur for devices to which a deployed rule was applicable only for a different platform, such as deploying Windows Client Health policy rules to macOS devices |
|
Unknown |
Rule hasn’t yet been delivered, evaluated or reported a compliance status. In the example above 20% of the policy rule deployments report as Unknown because one of the five devices to which policies have been deployed has remained offline for several days. |
The drill down navigates to the Rules Report filtered by Policy Rule Status, such as Policy Rule Status is Error.
Policy Rule Remediations Last 7 days
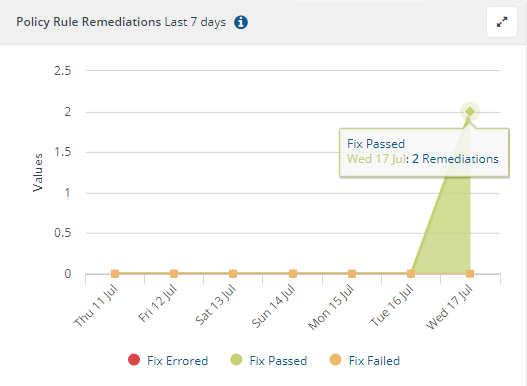
This pane shows a daily remediation summary applied to non-compliant devices by policy rules.
The drill down navigates to the Remediation report filtered by remediation status and timestamp period, such as remediation status is fixed and timestamp in a given time period.
