Service Watch Browser
Service Watch Browser is Real User Monitoring (RUM) for Software-as-a-Service (SaaS), third-party applications, and web applications you might not own but still want to monitor.
By watching the end user's browser, Exoprise Service Watch monitors business-critical web services and applications from the end user's perspective, focusing only on the domains and sites you care about.
Service Watch Browser is a browser extension that is easily deployed to all or a subset of users, with configurable filters to monitor select sites.
End-User experience
Service Watch Browser is for measuring actual end-user experience, no matter where the user is located, and it is perfect for remote and roaming users accessing business applications like Office 365, Salesforce, or Workday.
Service Watch Browser can operate against any list of domains and applications, internal or external cloud apps. Service Watch Browser enables IT administrators to debug and diagnose slow applications and poorly performing networks. For applications that IT can't or doesn't control, Service Watch Browser can provide long-term trending into service-level violations or real-time troubleshooting.
Who should run Service Watch Browser
Selecting end-user candidates to run Service Watch can vary depending on what you are trying to do. Trying to diagnose application performance for end users in remote locations or mobile users is a good starting point for Service Watch.
-
Mobile or remote users: Service Watch is excellent for measuring the performance of cloud and custom applications from the end-user perspective, no matter where they are located. If you have end users that telecommute or users that are on the go, invite them to install Service Watch extensions, and configure it for their most critical Line of Business (LOB) apps.
-
Branch office users: If you have pro users or administrators in branch offices, as well as knowledge workers that are dependent on apps like Office 365, SharePoint, OneDrive, and more, then they are good candidates for installing Service Watch.
-
Users that complain of slow performance: When you are troubleshooting slow performance or network problems for users, they can be great candidates for installing the Service Watch extension and configuring domains for their critical sites and apps.
-
IT or network administrators: To get an early understanding of how Service Watch works, you should invite other IT personnel to set up the Service Watch extension to monitor applications like Office 365, SharePoint, Service Now, and more.
Service Watch Browser configuration
Service Watch Browser allows you to monitor and benchmark specific websites from the end users' Microsoft Edge or Google Chrome browsers. You can add any internal or business-critical domains to track.
-
Once logged in, click Getting Started if you have not deployed anything, or click Next Steps in the top left if you have.
-
Under Real User Monitoring, click Add a Service Watch Extension configuration.
-
On the next screen, click Add Configuration, then click Next.
-
On the Domains screen, specify the domains you would like to monitor from the end users' browsers. You can also select domain sets to add predefined domains for O365, Salesforce, and GSuite. Once complete, click Next in the bottom right.
-
On the Users screen, you can invite users in the top right. Once the configuration is complete, they will receive an email with instructions on manually deploying the Service Watch Browser extension.
We recommend you try it yourself first. Choose end users that exist in different environments to understand their end-user experience.
You can also skip the users section by clicking Next and add the Service Watch Browser configuration to the Service Watch Desktop agent install on the next screen to deploy both at once.
-
On the Options screen, you can opt in to Enable Trace, which requires a Private Site. These Private Sites can also be used to deploy our CloudReady Synthetics. If you are planning on doing so, you can create the site by selecting deploy one. For instructions, refer to Guided site installation.
-
You can also set this Service Watch Browser configuration as the default Service Watch Desktop configuration. Once complete, click Next.
-
On the Confirm screen, add a Name and Notes for the configuration and click Finish.
Service Watch Browser widgets
By deploying Service Watch Browser, a dashboard will become available and provide you with visibility into the data collected.
The dashboard includes three types of widgets to make it easy to troubleshoot end users' performance issues.
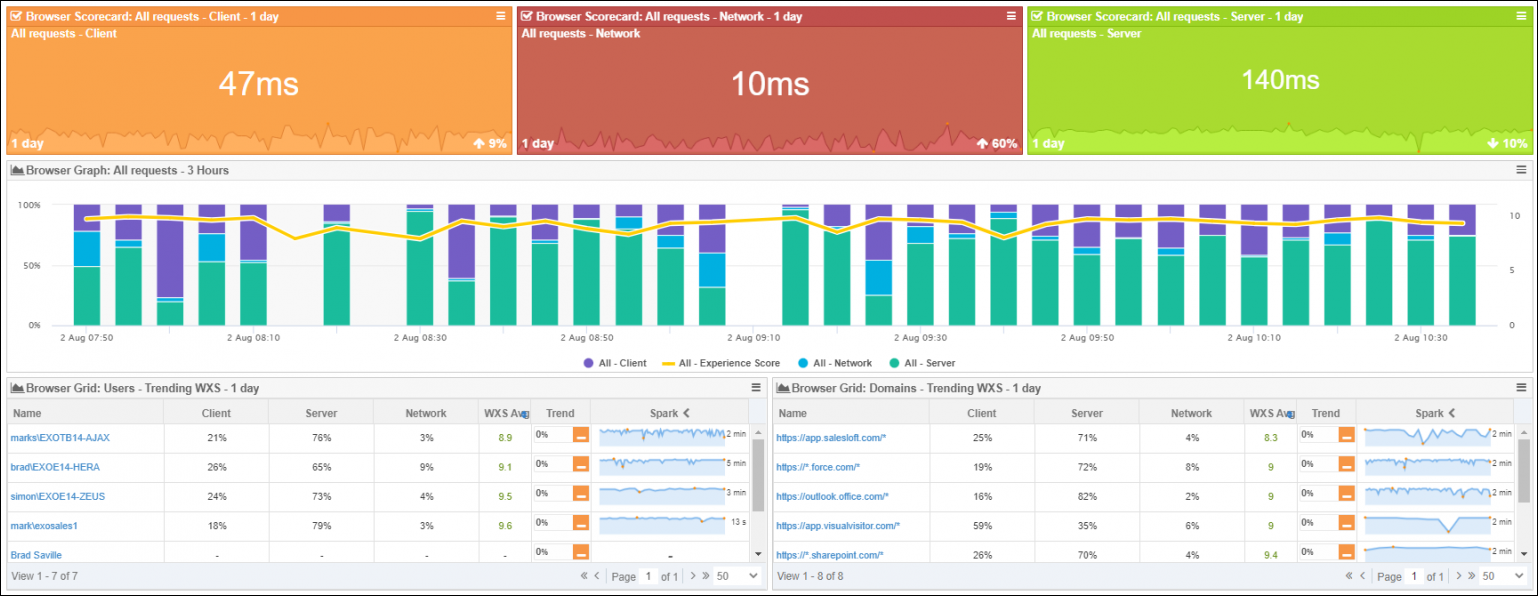
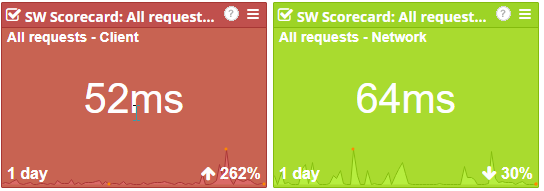
Service Watch Scorecard widget
This widget is ideal for visualizing performance metric averages, such as CPU or memory usage, across all devices or device groups.
Service Watch Scorecards give you insight into how the performance of the page is trending from the user's browsers. The Scorecards are ideal for visualizing network request performance for specific SaaS sites or users, no matter where the user is located.
The scorecard color for the metric changes depending on the recent trend over the selected period of time.
-
Green: The trend is less than a 5% increase.
-
Orange: The trend is between a 5 and 10% increase.
-
Red: The trend is greater than a 10% increase.
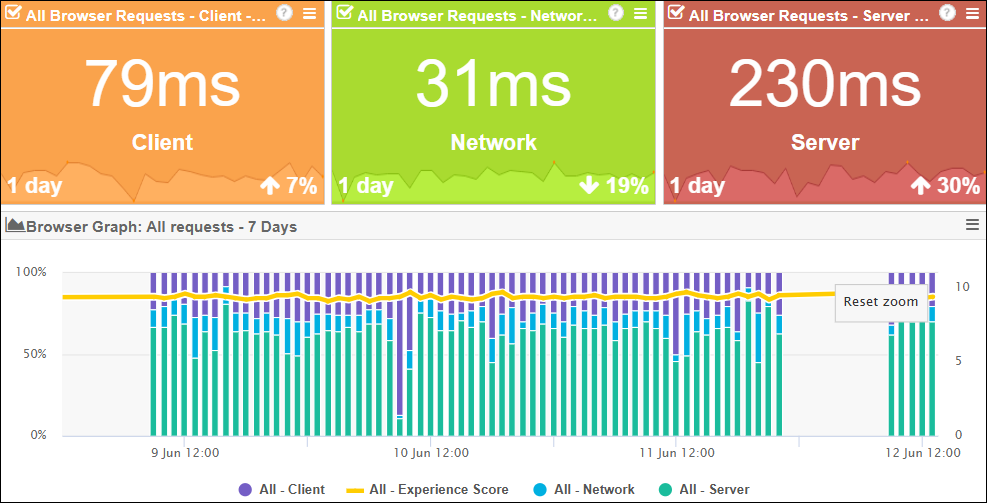
Service Watch Graph widget
The browser graph helps you see how the pages are performing and can be drilled into for more granular metrics. Chart any metric for any request (domain, user, or all). Add this widget and use the controls to select a trending metric and configure the time period for the graph. Values or percentages can be visualized for client, server, or network percentages and values. Different users or domains can be selected.
Use the Service Watch Graph widget to build specific tabs for different SaaS applications, or build a layout for different users in a group or department.
Service Watch Grid widget
This is a powerful widget for visualizing tables of requests filtered by domain or user. Choose from different metrics with full sorting capabilities and spark lines for trend visualization over different time periods such as daily, weekly, monthly, and more.
The Service Watch Grid widget allows you to quickly assess the network, client, and server performance from the end user's perspective for any website or SaaS property. Grids can be configured by user or domain to analyze specific user issues or specific SaaS application issues.
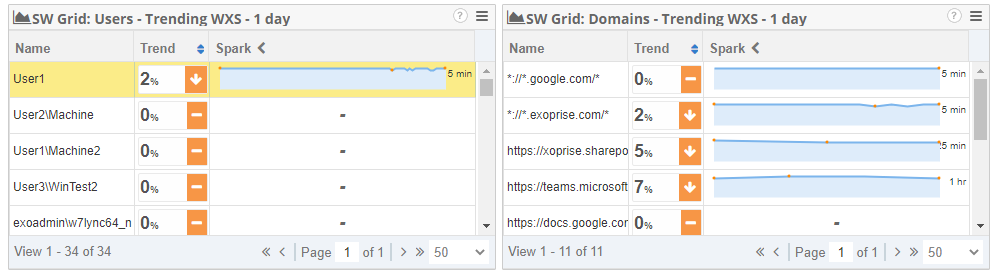
Once you select a domain or user, you can see a breakdown of the traffic itself under the following tabs at the bottom:
-
Errors: Errors that are generated from pages users accessed.
-
NPP: Network path performance shows hop-by-hop metrics of the transaction.
Web Experience Score (WXS)
The Exoprise Web Experience Score or WXS is an indicator of the overall health and performance of a user's or website experience. The purpose of the WXS is to encapsulate client, server, network, and background AJAX/XHR performance for websites and SaaS applications.
The WXS should be an estimate of an end user's web experience via their browsers. A higher score between 8 and 10 indicates good web and SaaS performance. Lower scores indicate slower web performance and, therefore, poorer experience.
In some ways, the WXS is similar to the Apdex, but the Apdex doesn't account for background requests, which are a growing part of the web experience and Single Page Apps.