macOS in 1E Experience Analytics
1E Experience Analytics provides experience information for macOS devices in addition to Windows devices. To support this Experience Analytics shows a variety of indicators on whether experience information is coming from macOS or Windows.
A key to badges
The following popup appears when you click on a badge in an Experience chart.
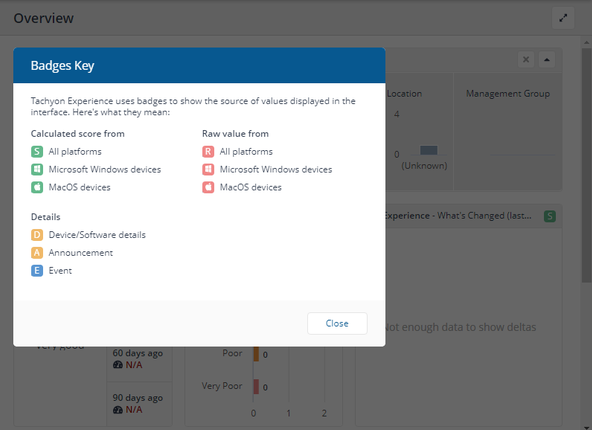
The following table shows the Badges and their descriptions.
|
Badge Icon |
Description |
|---|---|
|
|
Calculated score across all platforms. |
|
|
Calculated score from Microsoft Windows devices. |
|
|
Calculated score from macOS devices. |
|
|
Raw value from all platforms. |
|
|
Raw values from Microsoft Windows devices. |
|
|
Raw values from macOS devices. |
|
|
Device/Software details. |
|
|
Announcement |
|
|
Event |


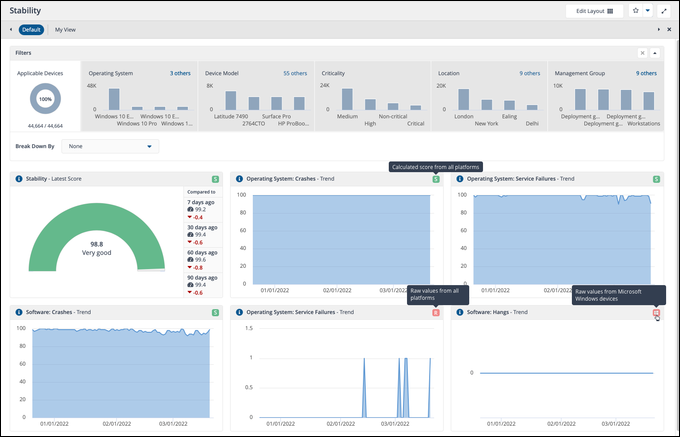
Badge tooltips
The badges that indicate the source for a chart also have tooltips that are displayed when you hover the mouse over the badge.
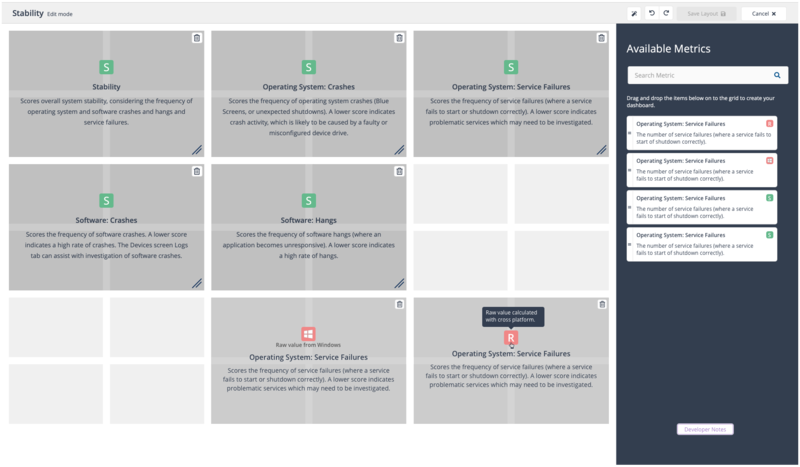
Edit Layout Badges
When selecting tiles in the Edit Layout page, the Available Metrics and selected tiles are badged according to the source of their information.
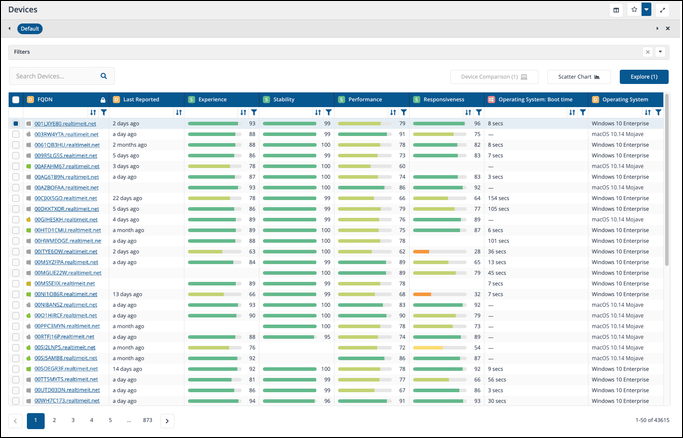
Inventory Management Devices page
On the Inventory Management > Devices page the Operating System: Boot time parameter, that is only applicable to Windows devices, displays a dash for any devices with a non-Windows OS.
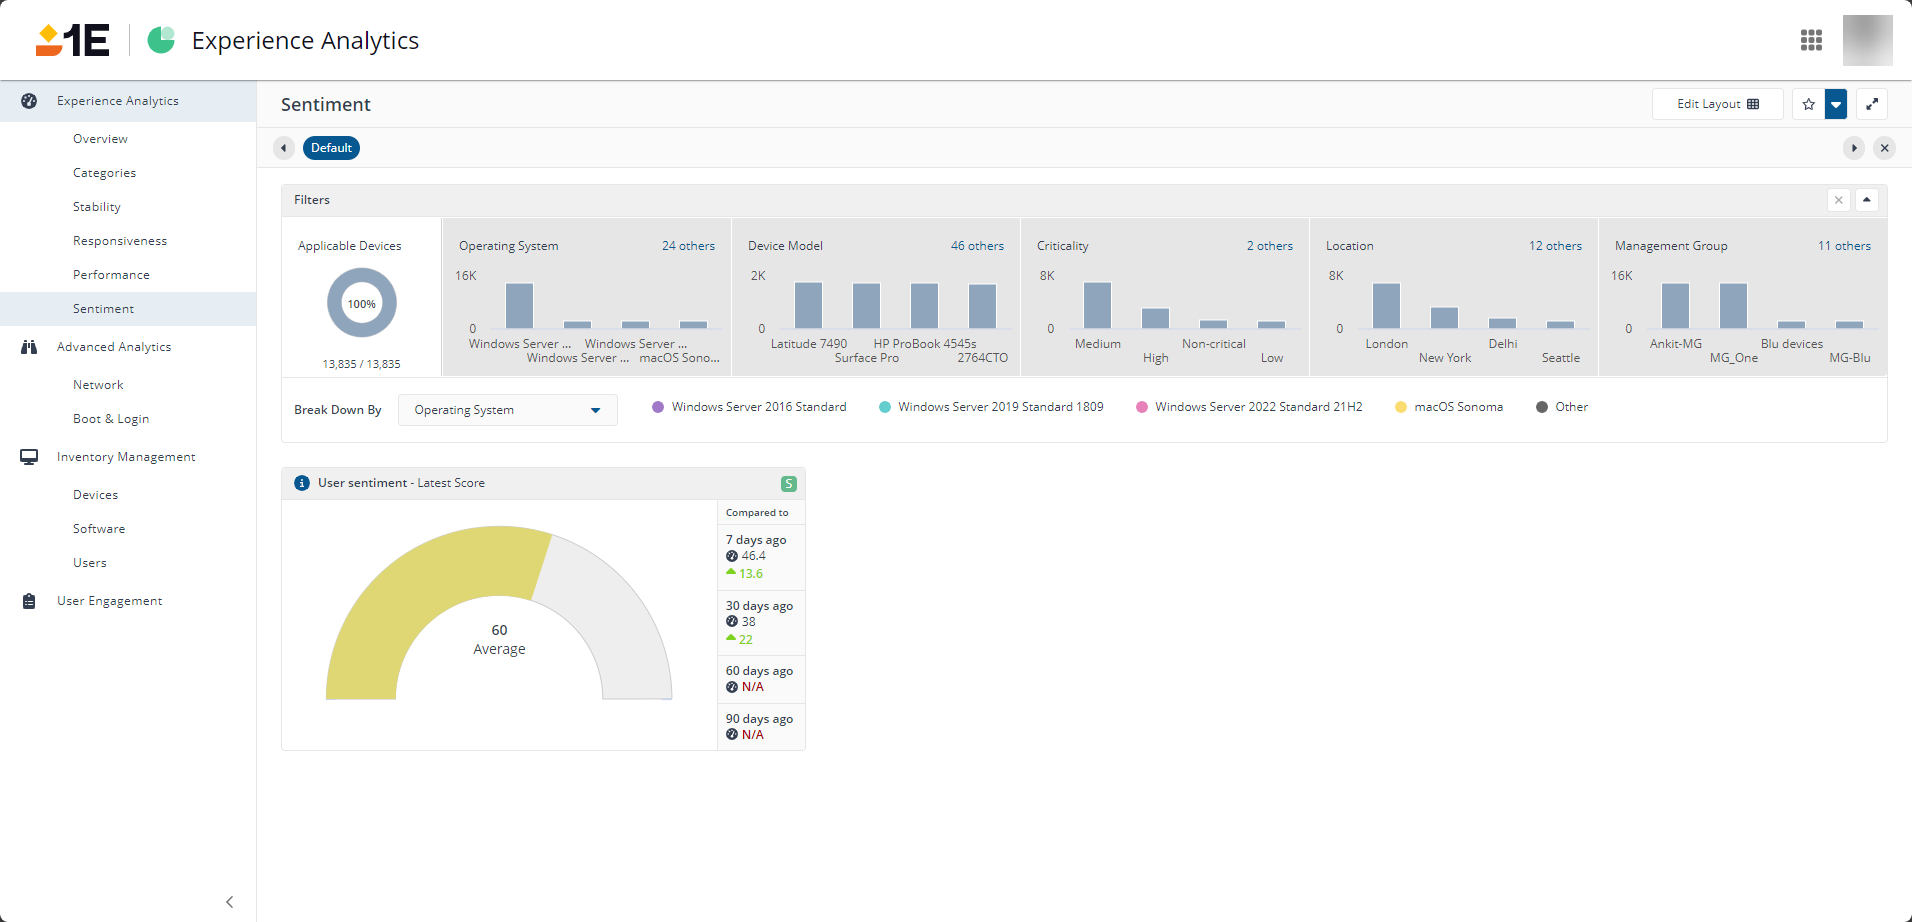
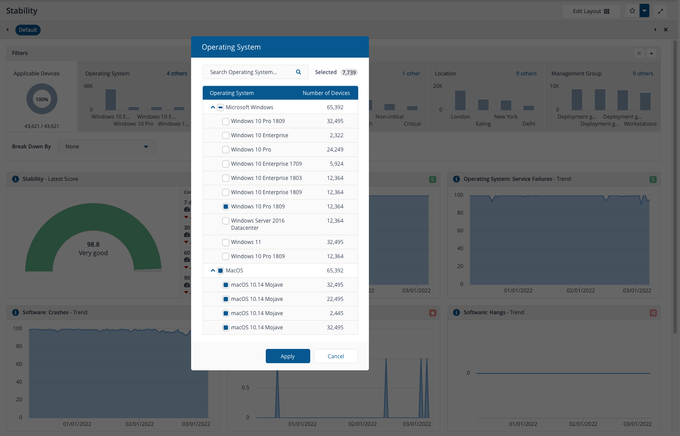
Operating System filter popup
The Operating System filter popup displays all of the Operating Systems in the sample data, both Windows and macOS. Here you can select the particular OS you are interested in and apply that as a filter to the page.
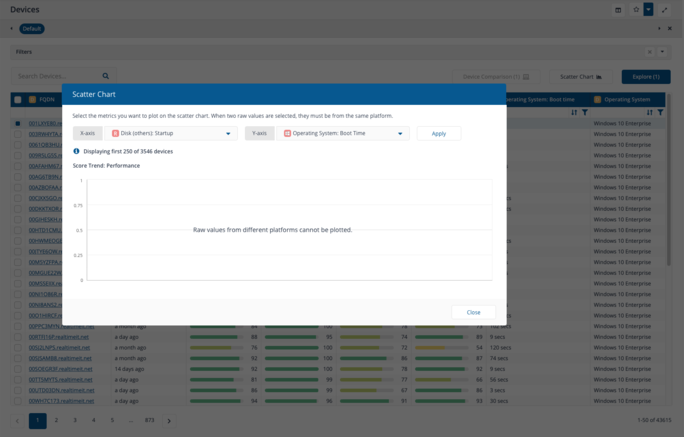
Scatter Chart with incompatible metrics selected
The Scatter Chart can only plot compatible raw metrics, if you select raw metrics for the x and y axes they must both be from the same platform. If they are not an advisory message is displayed Raw values from different platforms cannot be plotted.
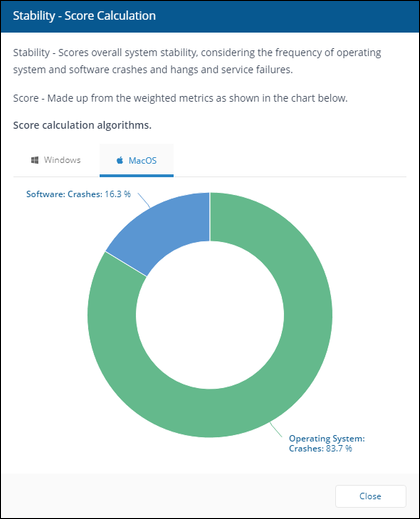
Score Calculation popup
The popup that is displayed when you click on the information icon on a chart provides descriptions for how the chart's score is calculated. If it is calculated differently for Windows and macOS a tab is displayed that lets you select the platform and see the relevant description.
For example, the following picture shows the stability score calculation for Microsoft Windows.
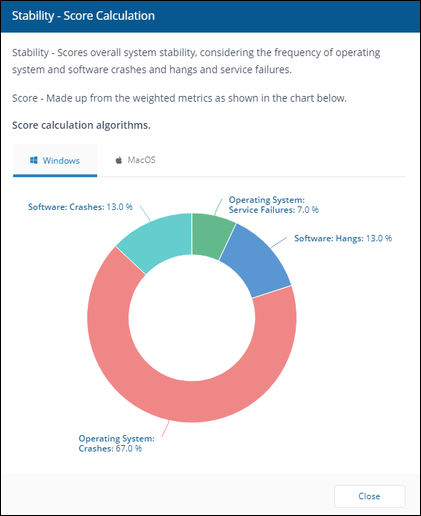
Whereas the stability score calculation for macOS is like the following picture.
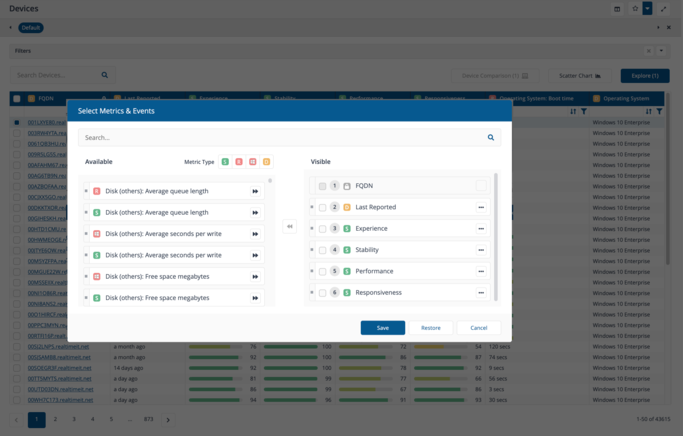
Select Metrics and Events
The Select Metrics & Events popup lets you choose the metrics you want to display in a table. Each available and visible metric is badged according to its type, you can also filter the Available metrics according to the badge types.
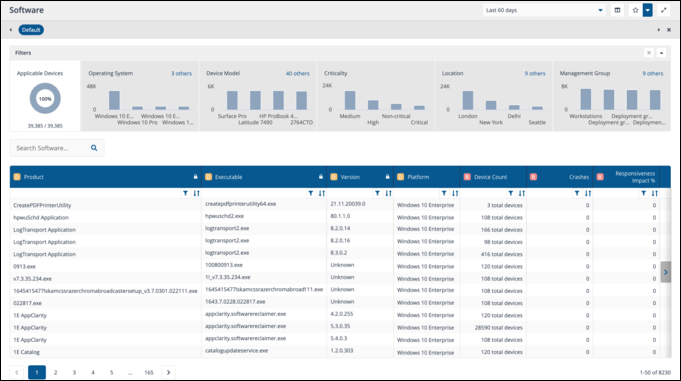
Software page with Platform column
The Software page now includes a Platform column that shows which platform the software is installed on.
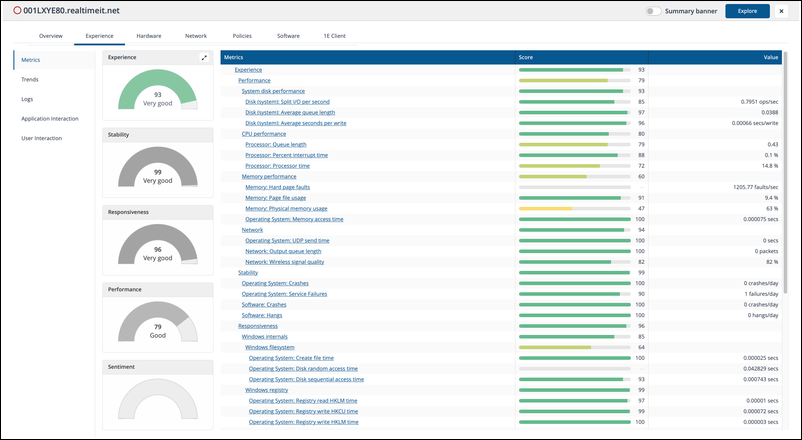
The Experience tab
The Experience tab in Device details will only display metrics that are relevant to the OS of the selected device.
Crash reporting on macOS now includes user-level application crashes:
-
Crash Detection Expansion: Crashes are detected and reported for user-level applications on macOS, this is in addition to the existing system-level application crash reports.
-
Data Integration: Crash data from applications is integrated into Trends and Experience Analytics data. This provides a unified view of application stability, capturing both system and user crashes across your macOS environment.
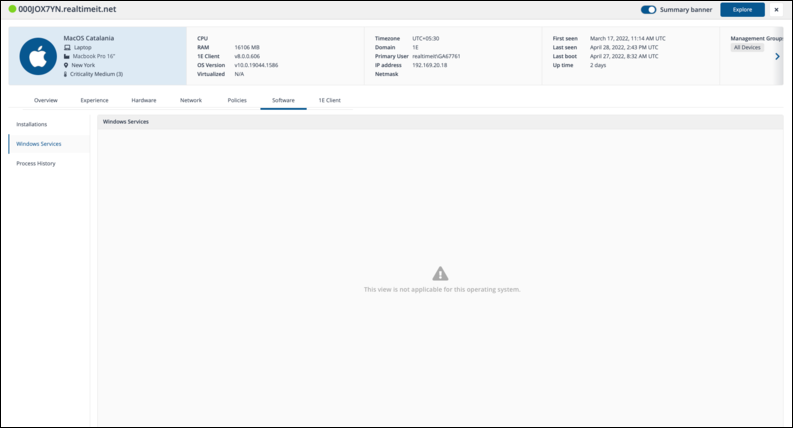
Views not relevant to a device's OS
In device details, if a view on a particular tab is not relevant to the OS of the selected device, an advisory is displayed.
For example, the following screenshot shows the Windows Services view on the Software tab on the device details for a macOS device.
The advisory reads This view is not applicable for this operating system.
Experience score
Administrators, can view responses from the macOS sentiment surveys implemented into the overall experience score, so you can provide a more accurate representation of user satisfaction and engagement within your environment.
Experience for macOS collects user response data from macOS sentiment surveys, including satisfaction levels, feedback, and interaction metrics.