Customizing Enterprise View
To illustrate how to customize Enterprise View, we are going to show you how to get the data from a database and display it as a chart as well as a table. Our example (ACME Corporation) uses a database that holds employee, customer and investor satisfaction ratings – the Happy table contains the following columns and data:
|
Happy states |
Employees |
Customers |
Investors |
|---|---|---|---|
|
Ecstatic |
543 |
123 |
58 |
|
Extremely Happy |
400 |
700 |
158 |
|
Happy |
390 |
323 |
89 |
|
Mildly Unhappy |
243 |
23 |
58 |
|
Extremely Unhappy |
143 |
12 |
38 |
|
Outraged |
0 |
1 |
4 |
Enterprise View ships with a set of XSD (XML schema defintion) files, which can be used when customizing tiles to validate the content and structure of the tile definition.
To display your data as a chart:
-
Define an SQL data source in the DataSources.xml file located in the Enterprise View\Dashboard.Web\Source folder.
Copy<DataSource Name="ACME">
<ConnectionProperties DataProvider="SQL">
<Value>
<![CDATA[Server=(local);
Database=ACME;
Trusted_Connection=True;
pooling=false]]>
</Value>
</ConnectionProperties>
</DataSource> - Create a tile definition XML file in the EnterpriseView\Dashboard.Web\Source\Tiles directory and add a DashboardTile element with command and presentation sections, the namespace used for the components and other attributes for the tile. For example, we create the following XML tile definition to display:
 Copy
Copy<?xml version="1.0" encoding="unicode" ?>
<DashboardTile xmlns="http://www.1e.com/2009/DashboardTile.xsd"
xmlns:chart=http://www.1e.com/2009/StandardChart.xsd
Type="Standard"
Title="ACME Happy Tile"
ThumbnailSource="columnchart.png"
Description=" The ACME employees, customers and investors happiness index"
RefreshFrequencyMins="60"
Activator="StandardChartActivator"> -
Type must be Standard for all user-defined tiles.
-
Title is the label for the tile.
-
ThumbnailSource is the location of image for the tile.
-
Description is a description for the tile.
-
RefreshFrequencyMins is the interval to refresh the tile – 60 minutes in our example.
-
Activator is StandardChartActivator which tells Enterprise View to retrieve the data in the correct format for the chart presentation.
-
Create the query to retrieve data for the chart. In our example, (ACME datasource, defined in step 1) the ACMESAT identifier is used in the presentation section.
Copy<CommandCollection>
<Command DataSource="ACME" Identifier="ACMESAT">
<Text><![CDATA[SELECT Happiness, Employees, Customers, Investors FROM dbo.Happy]]></Text>
</Command>
</CommandCollection> -
You can have one or more commands each defined in the <Command></Command>.
SQL data sources can also be used to run stored procedures to retrieve the required data, which is generally safer than running arbitrary SQL.
-
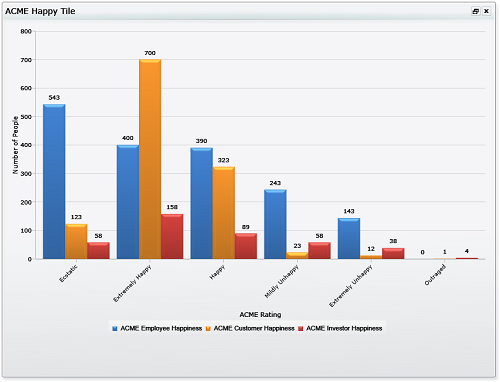
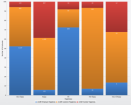
We are going to chart the number of people and their ratings for ACME Corporation using a series for each of the Employees, Customers and Investors data:
 Copy
Copy<Presentation>
<chart:StandardChart LegendEnabled="true"
AxisYTitle="Number of People"
AxisXTitle="ACME Rating">
<chart:SeriesCollection>
<chart:Series Type="Column"
LabelEnabled="true"
LegendText="ACME Employee Happiness">
<chart:DataPoint CommandIdentifier="ACMESAT"
YValueBinding="Employees"
AxisXLabelBinding="Happiness"/>
</chart:Series>
<chart:Series Type="Column"
LabelEnabled="true"
LegendText="ACME Customer Happiness">
<chart:DataPoint CommandIdentifier="ACMESAT"
YValueBinding="Customers"
AxisXLabelBinding="Happiness"/>
</chart:Series>
<chart:Series Type="Column"
LabelEnabled="true"
LegendText="ACME Investor Happiness">
<chart:DataPoint CommandIdentifier="ACMESAT"
YValueBinding="Investors"
AxisXLabelBinding="Happiness"/>
</chart:Series>
</chart:SeriesCollection>
</chart:StandardChart>
</Presentation>-
The Y axis is labeled Number of People and the X axis ACME Rating. The chart uses the Column type.
-
The ACMESAT identifier (defined in step 3) is used to retrieve the data, with the Y value binding set to the Employees, Customers and Investors columns for each series and the X value set to the Happiness rating
-
The legend for each series is set to ACME Employee Happiness, ACME Customer Happiness and ACME Investor Happiness respectively.
-
Where:
To display your data in a table:
-
Type must be Standard for all user-defined tables.
-
Title is the title for the table.
-
ThumbnailSource is the location of image for the table.
-
Description is a description for the table.
-
RefreshFrequencyMins is the interval to refresh the table – 60 minutes in our example.
-
Activator is StandardListViewActivator which tells Enterprise View to retrieve the data in the correct format for the table presentation.
-
We are going to use the data source you prepiously created for the chart.
-
Create the table definition XML file in the EnterpriseView\Dashboard.Web\Source\Tiles directory and add a DashboardTile element with command and presentation sections, the namespace used for the components and other attributes for the tile.
Copy<?xml version="1.0" encoding="unicode" ?>
<DashboardTile xmlns="http://www.1e.com/2009/DashboardTile.xsd"
xmlns:res="http://www.1e.com/2009/DashboardResources.xsd"
xmlns:para="http://www.1e.com/2009/StandardParagraph.xsd"
xmlns:table="http://www.1e.com/2009/StandardTable.xsd"
Type="Standard"
Title="ACME Happy Table"
ThumbnailSource="table.png"
Description="This table lets you know the ACME approval rating!"
RefreshFrequencyMins="60"
Activator="StandardListViewActivator">
-
Create the query to retrieve data from the table. We are going to use the query already created for the chart.
-
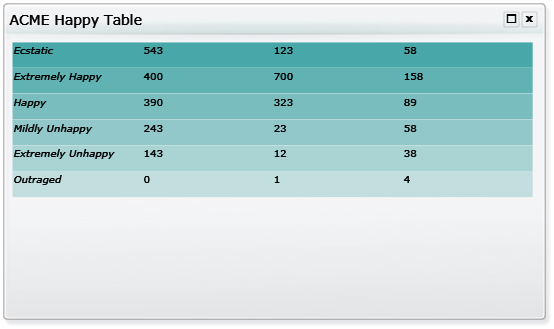
We are going to display the data for the number of people and their ratings for ACME Corporation using a columns and rows:
Creating a table
The following example sets the namespaces required for a table tile.
-
The type for all user-defined tiles must be set to Standard.
-
The title that appears on the banner for the tile and on the tile configuration page is set to ACME Happy Table.
-
The thumbnail and description that appear on the tile configuration page are set to table.png and a suitable description for the tile.
-
The RefreshFrequencyMins is set to 60 so the tile will be updated every hour.
-
The activator is set to the StandardListViewActivator which tells Enterprise View to retrieve the data from the data sources in the correct format for the table presentation type.
Copy<?xml version="1.0" encoding="unicode" ?>
<DashboardTile xmlns="http://www.1e.com/2009/DashboardTile.xsd"
xmlns:res="http://www.1e.com/2009/DashboardResources.xsd"
xmlns:para="http://www.1e.com/2009/StandardParagraph.xsd"
xmlns:table="http://www.1e.com/2009/StandardTable.xsd"
Type="Standard"
Title="ACME Happy Table"
ThumbnailSource="table.png"
Description="This table lets you know the ACME approval rating!"
RefreshFrequencyMins="60"
Activator="StandardListViewActivator">
Commands
The example can use exactly the same command used in the previous chart tile example.
<CommandCollection>
   <Command DataSource="ACME" Identifier="ACMESAT">
      <Text><![CDATA[SELECT Happiness, Employees, Customers, Investors FROM dbo.Happy]]></Text>
   </Command>
</CommandCollection>Presentation
The <Presentation> tag this time contains a single <table:StandardTable> definition, where table is an object name declared in a namespace definition in the tile's <DashboardTile> tag. The <table:ColumnCollection> tag defines general parameters for the table and holds the individual <table:Column> tag definitions.
The <table:ColumnCollection> tag sets the ACMESAT command to populate the table, turns off displaying of the column headings and sets the background color for the table to a green/blue color.
The ShowColumnHeader parameter is set to false. In this version the column headings do not support text formatting so it is usually best to not display them.
<Presentation>
   <table:StandardTable >
      <table:ColumnCollection CommandIdentifier="ACMESAT"
                              ShowColumnHeader="false"
                              BackgroundColor="#FF008888">
The following <table:Column> tag sets the data that will be displayed in the column using the Binding parameter. It also sets the column title, the column width and height and the height of the column heading.
The type of the column is set to html this allows HTML formatting to be applied to the contents of the column using the <table:FormatString> tag.
The Happiness binding is referenced in the format string using the {parameter} syntax. This substitutes the value for the binding into that location in the format string so in this example the column will display the Happiness value with a font size of 24 and with the emphasis style.
The CDATA syntax is used to allow the format string to contain characters that would normally require escape characters in XML.
<table:Column  Binding="Happiness"
       Title="Happy"
       Width="300" ContentHeight="60" Type="html">
   <table:FormatString>
      <![CDATA[<font size="24"><em>{Happiness}</em></font>]]>
   </table:FormatString>
</table:Column >
The following column definitions complete the table column collection.
<table:Column Binding="Employees" Title="Employees" Type="html" Width="300" ContentHeight="60" >
   <table:FormatString>
      <![CDATA[<font size="24">{Employees}</font>]]>
   </table:FormatString>
</table:Column >
<table:Column Binding="Customers" Title="Customers" Type="html" Width="300" ContentHeight="60" >
   <table:FormatString>
      <![CDATA[<font size="24">{Customers}</font>]]>
   </table:FormatString>
</table:Column >
<table:Column Binding="Investors" Title="Investors" Type="html" Width="300" ContentHeight="60" >
   <table:FormatString>
      <![CDATA[<font size="24">{Investors}</font>]]>
   </table:FormatString>
</table:Column >
</table:ColumnCollection>
In this example we also include a <StandardParagraph> tag that will display some descriptive text when the tile is maximized. This tag must be placed inside the <table:StandardTable> tag and only one is allowed.
<para:StandardParagraph>
   <para:Paragraph>
      <![CDATA[This table shows the happiness factor for the ACME corporation from the perspective of employees, customers and investors.]]>
   </para:Paragraph>
</para:StandardParagraph>
</table:StandardTable>
    </Presentation>
</DashboardTile>
Using the same data as in the previous chart example, this table definition results in the tile.
Enterprise View is a customizable dashboard where users can go and set up their own customized page showing the information being collected by the 1E products. Enterprise View tiles are defined using a set of XML files located at:
%installdir%\1E\EnterpriseView\Dashboard.Web\Source\
All files should end with the extension .xml and are validated by a set of XML schemas located at:
%installdir%\1E\EnterpriseView\Dashboard.Web\Source\Schemas
Specifying a data source
The tiles require data sources to display anything useful. The data sources must be added to the DataSources.xml file in the Enterprise View\Dashboard.Web\Source directory. By default the DataSources.xml file contains four data sources: Dashboard, NightWatchman, NightWatchmanServer and LOCAL.
The Dashboard data source relates to the Enterprise View settings, the NightWatchman and NightWatchmanServer relate to the data held by NightWatchman Management Center and NightWatchman Server Edition products. The fourth default data source called LOCAL refers to a local directory where you can store and retrieve XML data.
Data source types
There are two data source types, SQL and XML. XML data sources refer to XML format files held locally in the Enterprise View\Dashboard.Web\Source\LocalData directory. SQL data sources must have their SQL connection information defined.
Using your own database
If the database you are using as a data source is local to the Enterprise View website you need to add NT AUTHORITY/NETWORK SERVICE to the database users and grant that account the appropriate permissions for any specific tables you want to use in the database.
If the data source database is remote you need to add the machine account for the computer hosting the Enterprise View website. This will be in the format <DOMAIN> <MACHINENAME>$ where the <DOMAIN> is the domain where the host computer is running and <MACHINENAME> is the name of the computer hosting the Enterprise View website.
For example, given a server called ACMESVR030 running on the domain ACME, you need to add the following machine account as a user on the database:
ACME\ACMESVR030$
Creating an SQL data source
When creating an SQL data source, you need to specify the connection string to the database. This includes the server name, the database and configuration settings for the connection.
For example to create a data source for an ACME database residing locally to the Enterprise View website you would add the following to the DataSources.xml file as a new element of the DataSources element.
<DataSource Name="ACME">
   <ConnectionProperties DataProvider="SQL">
      <Value>
         <![CDATA[Server=(local);Database=ACME;Trusted_Connection=True;pooling=false]]>
      </Value>
   </ConnectionProperties>
</DataSource>
The XML LOCAL data source
If you want to use an XML file as the input data source for a tile, use the LOCAL data source already defined. All data files should reside in the folder, relative to the Enterprise View installation directory:
Enterprise View\Dashboard.Web\Source\LocalData
When specifying the command in the tile using the LOCAL data source, give the name of the file (see above) containing the data.
Defining an XML data file
The XML data file needs to obey the following format. The file must start with the xml version and encoding tag:
<?xml version="1.0" encoding="utf-8"?>
There must be a single <Result></Result> tag which contains all the rows of data. Each row of data must appear in a <Row> tag. Each column in the row must be defined as a number of column/value pairs separated by spaces in the following format:
ColumnName1="Value1" ColumnName2="Value2"
For example, the following shows an XML data file representing a four column data table where the columns are named Id, Month, PCSaving and ServerSaving.
<?xml version="1.0" encoding="utf-8"?>
<Result>
   <Row Id="0" Month="Sep 09" PCSaving="25399.00" ServerSaving="2500"/>
   <Row Id="1" Month="Oct 09" PCSaving="23872.00" ServerSaving="2389"/>
   <Row Id="2" Month="Nov 09" PCSaving="24977.00" ServerSaving="2700"/>
   <Row Id="3" Month="Dec 09" PCSaving="24293.00" ServerSaving="3214"/>
   <Row Id="4" Month="Jan 10" PCSaving="24556.00" ServerSaving="2847"/>
   <Row Id="5" Month="Feb 10" PCSaving="25675.00" ServerSaving="2837"/>
</Result>
XML format tile definition file
The contents of the tile definition file must start with the xml version and encoding tag:
<?xml version="1.0" encoding="unicode" ?>
DashboardTile tag
The tile definition must be placed in the <DashboardTile></DashboardTile> tag. The attributes for this tag lets you define general attributes for the tile, including the schemas for any presentation elements the tile definition uses and the tile's title, description and type. The following parameters can be set in the DashboardTile tag:
|
Parameters |
Notes |
|---|---|
|
Activator |
The activator specifies how data is actively retrieved for the tile. Each activator corresponds to the tile presentation elements that will be used in the tile. There are four supported activators to choose from but only one can be set per tile. The activators and corresponding presentation elements are:
|
|
Description |
Description for the tile as it appears in the configuration page of the Enterprise View website. |
|
RefreshFrequencyMins |
Duration (in minutes) between refreshing the data in the tile. |
|
ThumbnailSource |
Icon for the tile as it appears in the configuration page of the Enterprise View website. |
|
Title |
Title for the tile as it appears at the top of the tile and on the configuration page of the Enterprise View website. |
|
Type |
Must be Standard to enable the supported presentation elements described below. |
|
xmlns:<object> |
The schema definitions that are required to allow particular components to be used in a tile definition. Each xmlns line added to the DashboardTile tag sets a schema definition for a particular object reference. For example, to enable the use of resources to support internationalization, add: xmlns:res="http://www.1e.com/2009/DashboardResources.xsd" to the DashboardTile element. This uses the label res which must then be used when adding the resource definitions <res:ResourceDictionary Language="en-US"> |
Tile commands
Each tile command is used to gather information from a particular data source. You can have a number of commands defined in a single command collection each referring to the same or a different data source. All the commands must be placed in a single <CommandCollection></CommandCollection> tag, usually as the first element inside the DashboardTile tag.
The command definition must provide the name for a data source defined in the DataSources.xml file and an identifier that will be used to run the command in a presentation element. The command identifier must be unique within the tile definition but this is not checked by Enterprise View – you will need to ensure this is the case.
Each command must be defined using the <Command></Command> tag using the following format:
<Command DataSource="DataSourceName" Identifier="CommandID">
   <Text>
      Command...
   </Text>
</Command>
Where DataSourceName and CommandID is the data source and command identifier respectively and Command... is the command to run.
SQL commands
It is usual, though not required, to put the command definition in a CDATA statement. This allows XML reserved characters to be used in the command without the need for escape characters.
For example, the following command uses the ACME data source and selects the Rating and Number columns from the dbo.UserSatisfaction table in the database the ACME data source references. The command would then be used in a presentation element by referring to the ACMECMD identifier.
<Command DataSource="ACME" Identifier="ACMECMD">
   <Text>
      <![CDATA[ SELECT Rating, Number FROM dbo.UserSatisfaction ]]>
   </Text>
</Command>
XML commands
These commands always use the LOCAL XML data source and the command definition always consists of the name of the file containing the required data.
For example, the following command references the DepartmentCost.xml file which must be located in the LocalData directory. The command is then used in a presentation element by referring to the DEPTCOST identifier.
<Command DataSource="LOCAL" Identifier="DEPTCOST">
   <Text>DepartmentCost.xml</Text>
</Command>To use any of the tile presentation elements you must include a reference to its schema in the DashboardTile element as follows:
-
Standard tables: http://www.1e.com/2009/StandardTable.xsd
-
Standard paragraphs: http://www.1e.com/2009/StandardParagraph.xsd
-
Standard charts: http://www.1e.com/2009/StandardChart.xsd
-
Standard single vales: http://www.1e.com/2009/StandardSingleValue.xsd
Standard tables
When using the table presentation element, include the following namespace definition in the DashboardTile element. The table definition in the presentation section uses the table object name:
xmlns:table="http://www.1e.com/2009/StandardTable.xsd"
The outer element for a table definition is <table:StandardTable></table:StandardTable> all other atrributes must be placed inside this. The columns for the table definition must be placed within <table:ColumnCollection></table:ColumnCollection>. The following attributes can be set for ColumnCollection:
|
Attributes |
Default value |
Notes |
|---|---|---|
|
ShowColumnHeader |
|
Determines whether a header row is displayed for the table. Values are:
|
|
CommandIdentifier |
|
The command to use to populate the table. |
|
BackgroundColor |
|
Background color for the table in XAML color format: #OPRRGGBB where OP sets the color's opacity, RR, GG and BB sets the red, green and blue values respectively. For example, to set the background colour to green: BackgroundColor="FF00FF00" |
Inside <table:ColumnCollection>, add the <table:Column> attributes that define the actual contents of the table. The following attributes can be set for Column:
|
Attributes |
Default value |
Notes |
|---|---|---|
|
Type |
|
Sets the format of the contents. See Enterprise View image resources for a list build-in images and Supported HTML 4 tags for further details. Values are:
|
|
Width |
|
Width for the column. |
|
Title |
|
Column title. This can be used to set the title directly instead of defining TitleCommandIdentifier and TitleBinding. Title takes precedence over TitleBinding. |
|
TitleCommandIdentifier |
|
Command to be used to determine the column's title. |
|
|
Binding from the command set in TitleCommandIdentifier to be used as the column's title. |
|
|
TitleHeight |
|
Row height. Title also sets the font size to be used for the header row. |
|
ContentHeight |
|
Height for the contents rows for the column. |
Standard paragraphs
You can place a single standard paragraph in either the StandardTable or the StandardChart element. It must be placed inside the element but outside the ColumnCollection or SeriesCollection. The paragraph uses a limited subset of HTML 4 for formatting the text. See Supported HTML 4 tags for further details.
Standard charts
When using the table presentation element you could include the following namespace definition in the DashboardTile element, the table definition in the presentation section uses the table object name:
xmlns:chart="http://www.1e.com/2009/StandardChart.xsd"
The outer element for a chart definition is <chart:StandardChart></chart:StandardChart> all other chart attribute are placed within this. The following attributes can be set for StandardChart:
|
Attributes |
Default value |
Description |
|---|---|---|
|
AxisYTitleCommandIdentifier |
|
This must be set to a command that will retrieve the data for the chart. |
|
LegendEnabled |
|
Shows or hides the legend identifying each data series on a chart. Values are:
|
|
AxisXTitle |
|
Text for the X Axis title. AxisXTitle overrides AxisXTitleCommandIdentifier and AxisXTitleCommandBinding . |
|
AxisXTitleCommandIdentifier |
|
The X Axis title. Used in conjunction with AxisXTitleCommandBinding . |
|
AxisXTitleCommandBinding |
|
The X Axis title. AxisXTitleCommandBinding is retrieved from the results of AxisXTitleCommandIdentifier . |
|
AxisYTitle |
|
The Y Axis title. AxisYTitle overrides AxisYTitleCommandIdentifier and AxisYTitleCommandBinding . |
|
AxisYTitleCommandIdentifier |
|
The Y Axis title. Used in conjunction with AxisYTitleCommandBinding . |
|
AxisYTitleCommandBinding |
|
The Y Axis title. AxisYTitleCommandBinding is retrieved from the results of AxisYTitleCommandIdentifier . |
All the data series required for the chart should be placed inside the <chart:SeriesCollection></chart:SeriesCollection> element. Each data series is defined using <chart:Series></chart:Series>. The following attributes can be set for Series:
|
Attributes |
Default value |
Description |
|---|---|---|
|
AxisXFormatString |
|
The format for AxisXLabelBinding . |
|
AxisXLabelBinding |
|
Must be bound to a value returned by CommandIdentifier . |
|
CommandIdentifier |
|
Sets a command that will retrieve the data for the series. |
|
Color |
|
The color for the chart series. |
|
YValueBinding |
|
Must be bound to a value returned by CommandIdentifier . |
|
YValueFormatString |
|
The format for the YValueBinding . |
|
Type |
|
Must be set to the type of the chart to be used to display the series. |
|
LabelEnabled |
|
Shows or hides the label. Values are:
|
|
LegendText |
|
Text for the series in the chart legend. |
|
Name |
|
Name for the series. |
Chart combinations
It is possible to combine different chart types by using a different chart for each data series. This is subject to the following restrictions:
-
The Pie and Doughnut charts cannot be combined with each other or any other chart.
-
The Bar, StackedBar and StackedBar100 can be combined with each other but not with any other chart type.
Chart types
The following table shows the chart types available for use with Enterprise View. The chart names are case sensitive so you need to be careful with capitalization of the chart names when adding them to the tile definitions.
|
Chart type |
Chart |
Notes |
|---|---|---|
|
Area |
|
Displays an area chart. This is a line chart that is filled to the X axis. |
|
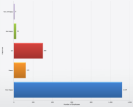
Bar |
|
Displays a bar chart, where the y value for each value of x is shown as a horizontal bar. |
|
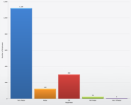
Column |
|
Displays a column chart, where the y value for each value of x is shown as a vertical bar. |
|
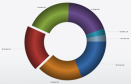
Doughnut |
|
Displays a doughnut chart, where the y value for each distinct value of x is displayed as a sector of a ring. This shows the proportion between the distinct values. |
|
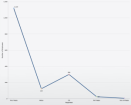
Line |
|
Displays a line chart, where the y value is plotted against each distinct value for x. |
|
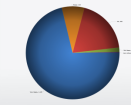
Pie |
>
|
Displays a pie chart, where the y value for each distinct value of x is displayed as a sector of a circle. This shows the proportion between the distinct values. |
|
Point |
|
Displays a point chart, where the y value is plotted against each distinct value for x. |
|
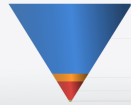
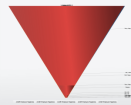
SectionFunnel |
|
A section funnel chart is displayed as an inverted pyramid, where the shape of the chart is fixed and the different values are shown as layers inside. This allows the relative sizes of the values to be determined whilst indicating a general importance relationship between the parameters shown at the top and the ones at the bottom. |
|
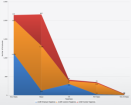
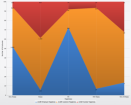
StackedArea |
|
The stacked area chart shows each set of y values as area charts stacked above one another. This allows easy visualization of the proportions between the values and how these proportions change with the corresponding x values. |
|
StackedArea100 |
|
The stacked area 100 chart shows a stacked area chart where each set of y values is adjusted to show the percentage relationship between the individual values. |
|
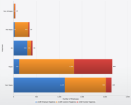
StackedBar |
|
The stacked bar chart shows each set of y values as bars stacked beside one another. This allows easy visualization of the proportions between the values and how these proportions change with the corresponding x values. |
|
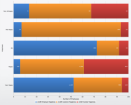
StackedBar100 |
|
The stacked bar 100 chart shows a stacked bar chart where each set of y values is adjusted to show the percentage relationship between the individual values. |
|
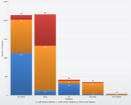
StackedColumn |
|
The stacked bar chart shows each set of y values as bars stacked beside one another. This allows easy visualization of the proportions between the values and how these proportions change with the corresponding x values. |
|
StackedColumn100 |
|
The stacked bar 100 chart shows a stacked bar chart where each set of y values is adjusted to show the percentage relationship between the individual values. |
|
StreamLineFunnel |
|
|
Standard single value
When using the standard single value presentation element you would include the following namespace definition in the DashboardTile element, the definition in the presentation section would subsequently use the value object name:
xmlns:value="http://www.1e.com/2009/StandardSingleValue.xsd"
The only standard single value type currently supported is the Gauge. This takes a single data binding and displays the value on a speedometer. Gauges require that the Activator attribute in the DashboardTile element is set to GaugeActivator.
Single value definitions
The tag for a single value definition is <value:StandardSingleValue></value:StandardSingleValue>. The following attributes can be set in the StandardSingleValue tag:
|
Attributes |
Notes |
|---|---|
|
CommandIdentifier |
The binding for the gauge. |
|
Binding |
Parameter from the command used to set the value for the gauge. |
|
Type |
Currently only the Gauge type is supported. |
|
MinimumValue |
Minimum value for the gauge. |
|
MaximumValue |
Maximum value for the gauge. |
|
Unit |
Text for the units description that appears in the center of the gauge. |
|
Precision |
Precision for the digit display. |
By default, Enterprise View tiles are set to not refresh. That is, in order to view any data that has changed in the database or local XML data must refresh or reload the page. There is an auto-refresh parameter that can be set as part of the tile definition that makes the tile automatically re-run its query to get any new data at a specified interval.
To do this, add the RefreshFrequencyMins parameter to the DashboardTile element.
<?xml version="1.0" encoding="utf-16" ?>
<DashboardTile xmlns="http://www.1e.com/2009/DashboardTile.xsd"
               xmlns:table="http://www.1e.com/2009/StandardTable.xsd"
               xmlns:res="http://www.1e.com/2009/DashboardResources.xsd"
   Title="{Title}"
   Description="{Description}" Type="Standard"
   Activator="StandardListViewActivator"
   ThumbnailSource="table.png"
   RefreshFrequencyMins="5">
Defining tile permissions
By default, there are no permissions defined. This means that all users have access to Enterprise View. Enterprise View handles tile permissions through definitions for roles and users. The roles are defined with the specific tiles they are able to view and users are then associated with these roles.
Tile access is configured by creating the following file in:
%programfiles%\1E\Dashboard\Dashboard.Web\Source\TileAuthorization.xml
An empty version of the file contains the following:
<?xml version="1.0" encoding="utf-8" ?> <Authorization xmlns="http://www.1e.com/2009/TileAuthorization.xsd"> </Authorization>
Defining Roles
Roles are defined within the <Role> element which has the following attributes:
|
Attributes |
Default value |
Notes |
|---|---|---|
|
Name |
|
The name for the role. Used when defining the users that have the role. |
|
Description |
|
A description for the role. |
|
DefaultPermission |
Allowed |
Sets the default permission for the role. Values are:
|
Adding an exception to the role definition counteracts the default permission for the role for a particular tile. You can either leave the default permission for the role as Allowed and define exceptions for tiles where access is denied, or you can set the default permission to Denied and define exceptions where access is allowed.
The following illustrates a definition where Developers have access to all tiles except FirstTile and SecondTile:
<Role
   Name="Developers"
   Description="Developers and Technicians Role" >
   <Exception TileIdentifier="FirstTile"/>
   <Exception TileIdentifier="SecondTile"/>
</Role>
The following illustrates a definition where Developers cannot access any tiles except FirstTile and SecondTile.
<Role
   Name="Developers"
   Description="Developers and Technicians Role"
   DefaultPermission="Denied" >
   <Exception TileIdentifier="FirstTile"/>
   <Exception TileIdentifier="SecondTile"/>
</Role>
Defining Users
Having defined the roles, you associate them with specific users. This is done with <RoleAccountMapping> which has a single attribute that specifies the role being associated.
-
Role – set to the name of a previously defined Role name.
Next, you add account definitions for each user you want to associate with the named role. This is done with <Account> which has a single attribute that specifies the user account:
-
Name – set to the AD account name for the user.
For example, the following sets a user for the Developers role defined earlier:
<RoleAccountMapping Role="Developers">
   <Account Name = "ACME\Ned.Zeppelin" />
</RoleAccountMapping>
Globalization
To enable globalization and resources for a particular tile, add the following to the DashboardTile tag:
xmlns:res="http://www.1e.com/2009/DashboardResources.xsd"
The resource dictionary and setter definitions use the object name ref. The resources are defined in <Resources></Resources>. Each collection of language resources are defined in <res:ResourceDictionary></res:ResourceDictionary> which has a single attribute that defines the language code used.
-
Language – defines the language code. This is matched against the language code used in the browser where the tile is displayed. For example, the following illustrates a resource dictionary for US English:
Copy<res:ResourceDictionary Language="en-US">
…US English setters go here…
</res:ResourceDictionary>
The contents of a resource dictionary consist of <res:Setter> entries where you can set the following attributes:
-
Property – the name used to reference the resource.
-
Value – the value to be substituted where the property name is referenced.
For example, the following illustrates a resource setter for a en-US resource dictionary:
<Resources>
<res:ResourceDictionary Language="en-US">
   <res:Setter Property="Title" Value="Aluminum" />
</res:ResourceDictionary>
And the following is the equivalent resource for an en-GB resource dictionary:
<Resources>
<res:ResourceDictionary Language="en-GB">
   <res:Setter Property="Title" Value="Aluminium" />
</res:ResourceDictionary></Resources>
This is referenced in the DashboardTile element for a tile definition as follows:
<DashboardTile xmlns="http://www.1e.com/2009/DashboardTile.xsd"
               xmlns:res="http://www.1e.com/2009/DashboardResources.xsd"
   Title="{Title}"
   …rest of tag definition…>
When viewing the tile, it is displayed as Aluminum or Aluminium depending on the en-US or en-GB language set.
Setting default dashboard tiles
If you want users to see a default set of tiles when they first connect to the Enterprise View website, rather than having to go through the configuration stage, add a DefaultDashboard.xml definition to the Enterprise View\Dashboard.Web\Source\Dashboards directory. This file contains a list of named tiles to display.
The following shows an example DefaultDashboard.xml definition with eight of the NightWatchman tiles set as default.
<?xml version="1.0" encoding="utf-8" ?>
<Dashboard xmlns="http://www.1e.com/2009/Dashboard.xsd">
  <Tile Path="NWMPowerSchemeCompliance.xml"/>
  <Tile Path="NWMSavingsToDate.xml"/>
  <Tile Path="NWMDailyPowerCost.xml"/>
  <Tile Path="NWMInstalledOperatingSystems.xml"/>
  <Tile Path="NWMMonthlySavings.xml"/>
  <Tile Path="NWMEnergyCostPerCapita.xml"/>
  <Tile Path="NWMTopFiveHardwareTypes.xml"/>
  <Tile Path="NWMTopFiveWorstHardwareTypes.xml"/>
</Dashboard>Built-in image resources that may be used as the ThumbnailSource parameter for the tile definitions are:
|
Graphic |
Image resource for ThumbnailSource |
|---|---|
|
|
areachart.png |
|
|
barchart.png |
|
|
columnchart.png |
|
|
costSavings.png |
|
|
energyStar.png |
|
|
linechart.png |
|
|
piechart.png |
|
|
table.png |


Built-in image resources that may be used in table columns when they are set to image type.
|
Graphic |
Image resource for table columns |
|---|---|
|
|
Barrel.png |
|
|
Building.png |
|
|
Car.png |
|
|
Co2.png |
|
|
Computer.png |
|
|
Emission.png |
|
|
Group.png |
|
|
Laptop.png |
|
|
Money.png |
|
|
Tree.png |


The following HTML code is supported in table column definitions when the style is set tohtml.Silverlight does not support HTML in its text blocks by default. Enterprise View supports a subset of HTML to allow rudimentary formatting of text in table columns.
|
Supported elements |
Descriptions |
|---|---|
|
Text |
The following text element tags are supported: <p>This is a paragraph</p> <br /> |
|
Logical styles |
The following logical text formatting style tags can be used: <em>This text is emphasized</em> <strong>This text is strong</strong> |
|
Physical styles |
The following physical text formatting style tags can be used: <b>This text is bold</b> <i>This text is italic</i> |
|
Links |
Links can be added using the standard HTML link tag: <a href="http://www.example.com/">Link-text goes here</a> |
|
Font |
Font formatting can be set directly using the following HTML 4 tag: <font face="times, serif" size="3" color="XAML color format"> Sample text formatted with the deprecated FONT tag. </font> |