Metrics and filtering
Learn how to use metric filtering in the Platform to refine dashboards, reports, and analytics by narrowing results to the most relevant endpoint, user, or performance data. This reference explains the available filter options, filtering behavior, and best practices for improving data analysis, troubleshooting, and operational decision-making.
In the upper right corner of the page you can see the following tools:
-
Click the Select Metrics & Events icon to add or remove columns from the tabular listing.
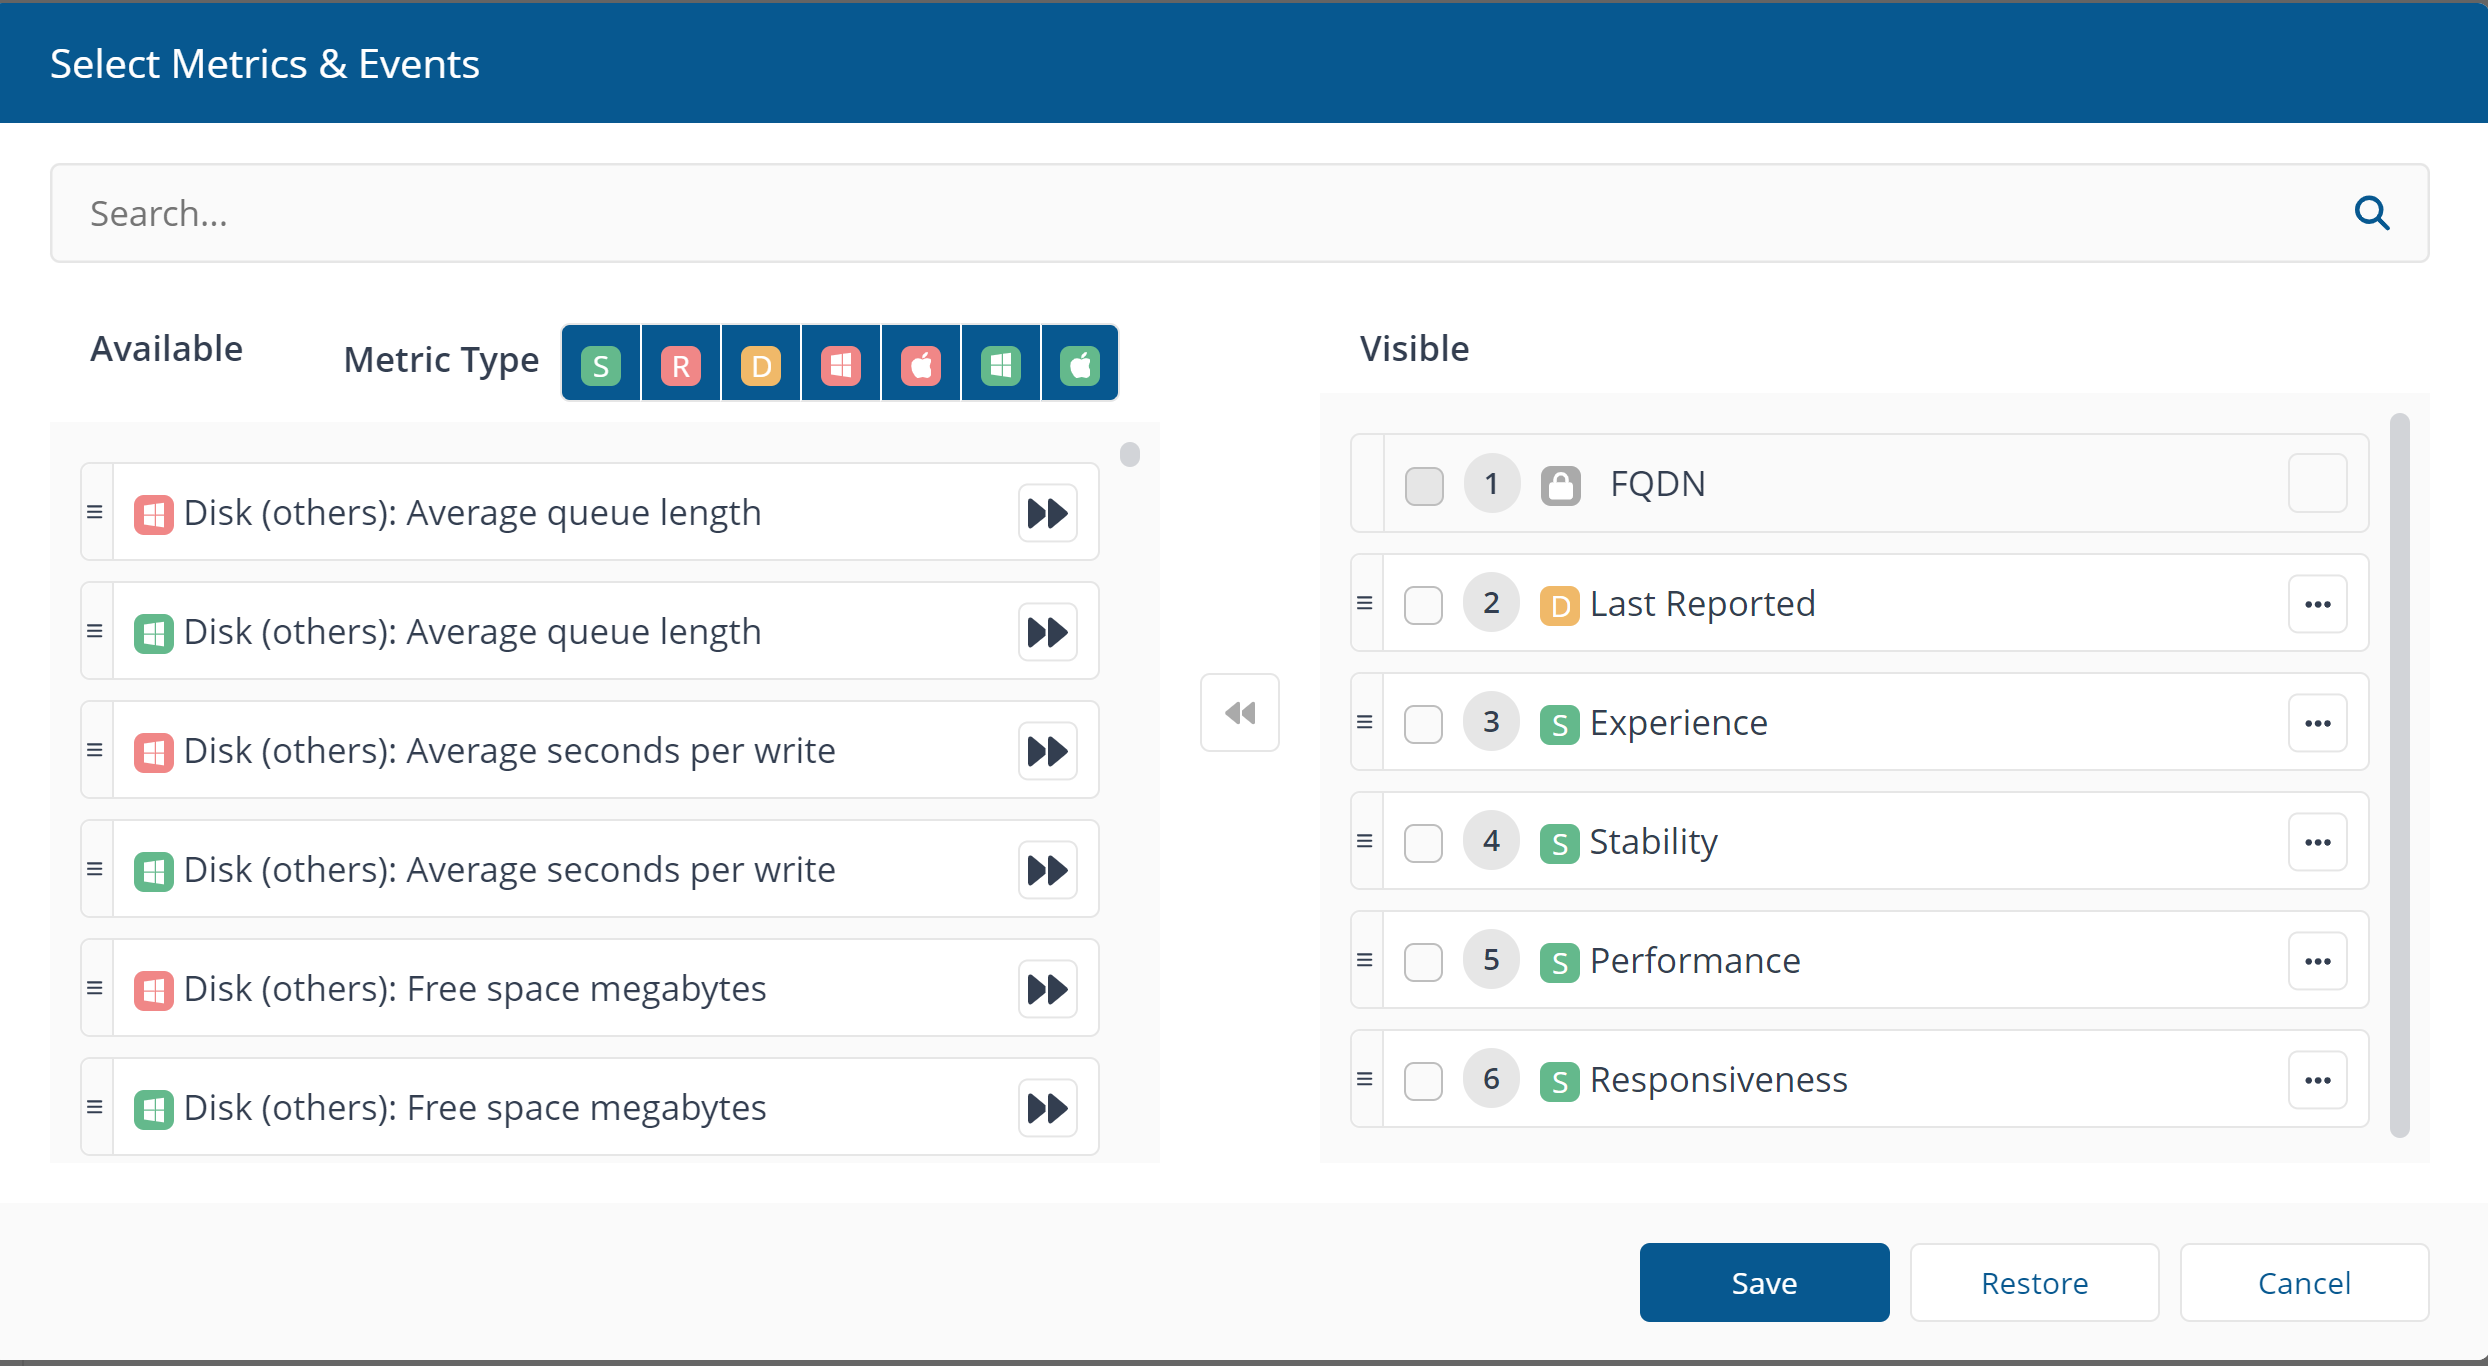
Depending on what page you are on will determine what metrics can be selected. Each page has different metrics available. The screenshot above is an example of what is shown on the Experience Analytics Devices page.
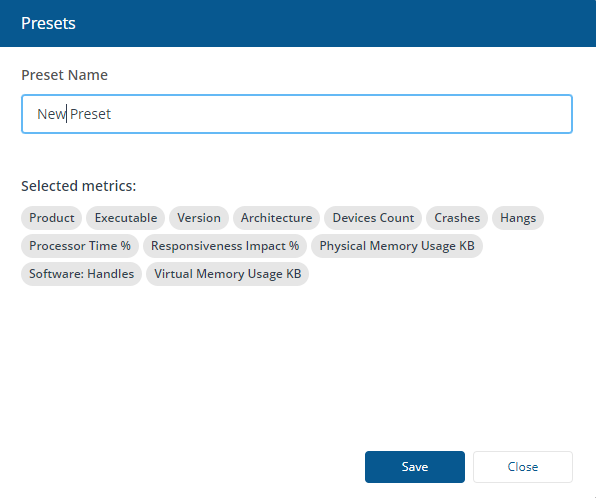
- Once you have selected your required columns and saved them, you can save this configuration as a preset by clicking the Set page configuration as preset icon. Enter a preset name and click Save.
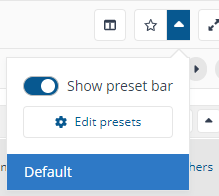
- Click the drop-down arrow to show or hide the preset bar on the page and to edit your presets.
On some pages you will have an option to filter. The Filters section allows you to center your insights on specific areas of the environment, for example, specific operating systems and/or locations.
Additionally on some pages you can select to display data for the last 90, 60, 30, or 7 days.