Using Virtual Desktop Experience
This article provides an overview of VDX features.
VDX features and user interfaces are consistent for both Citrix on-premises and Citrix Cloud environments.
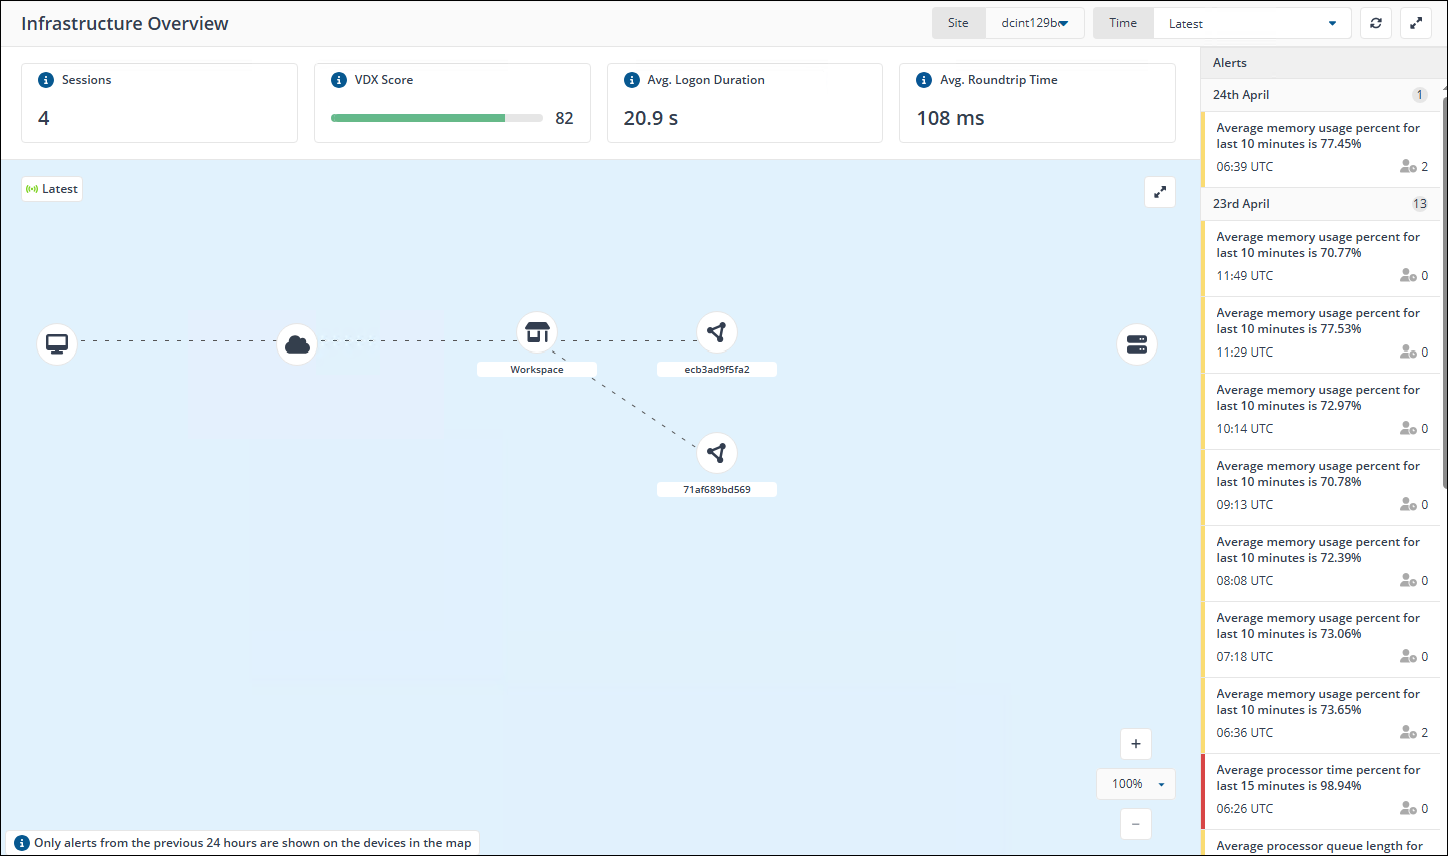
Infrastructure Overview
The Infrastructure page is divided into several key sections: metrics and KPIs, drop-down menus, infrastructure topology, and the alerts drawer.
Metrics and KPI
At the top of the page are the four main KPI used for VDI.

- Sessions: This is the total number of user sessions that are or were live in the infrastructure, based on the applied filters.
- VDX Score: The Virtual Desktop Experience Score is calculated for the matching sessions by combining their logon durations, roundtrip times, drop-offs, auto-reconnects, and device loads that impact each session.
- Average Logon Duration: Logon duration is the time it takes for a user to have an interactive virtual session. This metric represents the average logon duration of all live sessions in the selected site.
- Average Roundtrip Time: Roundtrip time is the delay between the moment a user presses a key and when the response is displayed. This metric represents the average roundtrip time of all live sessions in the selected site.
Infrastructure Overview dashboard
For Citrix cloud-hosted environments, some on-screen details that were previously visible in an on-premises setup are not viewable. For example, the database information is not displayed, the delivery controller appears with its internal name rather than the full FQDN, and IP-related details are omitted.
There are a number of options available at the top of the page.
|
Option |
Description |
|---|---|
|
Site |
You can select which Citrix Site you are viewing the VDI deployment for. |
|
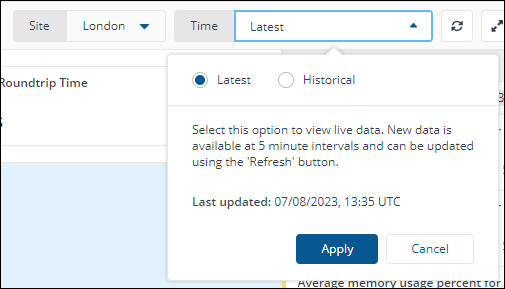
Time |
Use the Time drop-down menu to view the infrastructure topology at a previous moment in time. The Time option allows you to go back up to 7 days. |
|
Refresh |
The Refresh button can be used to refresh the page. |
|
Fullscreen |
The Fullscreen button can be used to maximize the view, removing the page header and left-hand navigation bar from view. |
Infrastructure topology
This provides end-to-end visibility of your VDI deployment, including:
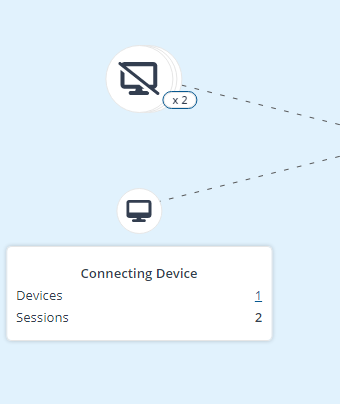
- Connecting Devices: Each connecting device type has a session and device count associated with it, and is categorized into the following:
Server
Desktop
Laptop
Mobile
Unmanaged Devices
Any device that doesn’t have a 1E Client installed falls under the category of Unmanaged devices. Devices with a 1E client installed are categorized as either Server, Desktop, Laptop, or Mobile. The device type value is set in the device type column of the Device table in 1E Experience.
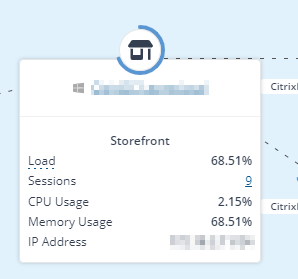
- Storefronts: Takes you to the session list page, where you can view the list of sessions associated with the selected storefront. If the 1E Client is installed on the node, you will be able to leverage other capabilities of the 1E Platform. Additionally, the following data will be displayed:
-
Load, generated from a combination of CPU and Memory usage
-
Sessions
-
CPU Usage
-
Memory Usage
-
IP Address
-
Delivery Controllers: Directs you to the session list page, where you can view sessions associated with the selected delivery controller. The alerts count displayed represents a single day, starting from midnight. For instance, if you select the latest date and time from the picker, it will show the alerts for the current day, beginning at midnight and continuing up to the current UTC time.
-
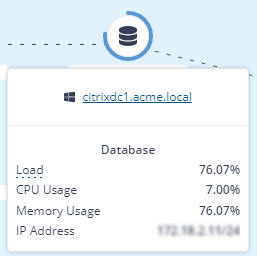
Databases:
-
Hypervisor: Usually represented in the form of an expandable hive or group.
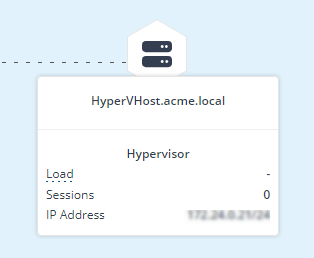
You can receive alerts from the Hypervisor, Delivery Controller, Storefront, and Database nodes. To receive alerts from these nodes, you'll need to configure a 1E Client on them. Whenever the rule condition fails, an alert is generated from those nodes.
Connecting Device Drawer
Clicking on the device count link on the Connecting Device node opens a drawer providing a list of devices associated with a particular device type.
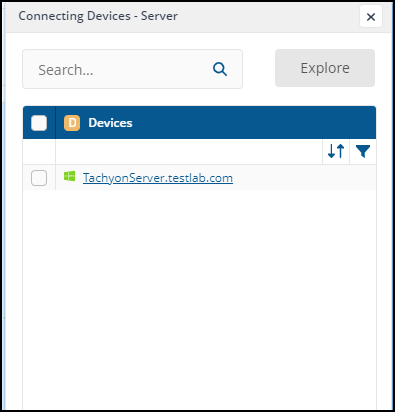
The drawer has the following functionality:
-
Search using the device name filters.
-
Showing the device type using the icon displayed alongside the name.
-
Showing the online status of the device by applying the color scheme on the device type icon.
-
Sorting the list of devices in alphabetical order.
-
Selecting devices and clicking Explore opens the 1E Platform instruction page where device coverage is pre-filled with the selected devices.
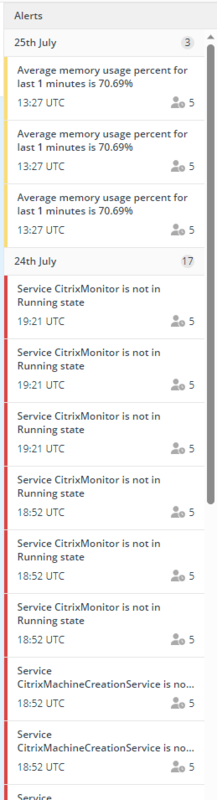
Alerts drawer
The Alerts draw displays alerts raised for your Citrix Site. This feature requires the following:
-
The 1E Client must be installed on the relevant nodes of your VDI deployment for alerting to function on those devices.
-
The Alerting DEX pack must be enabled in 1E Endpoint Automation. This pack is automatically enabled when VDX is switched on.
You can drill into alerts in the drawer to see additional details. Alerts raised in the last 24 hours will also display as badges on relevant nodes in the infrastructure topology.
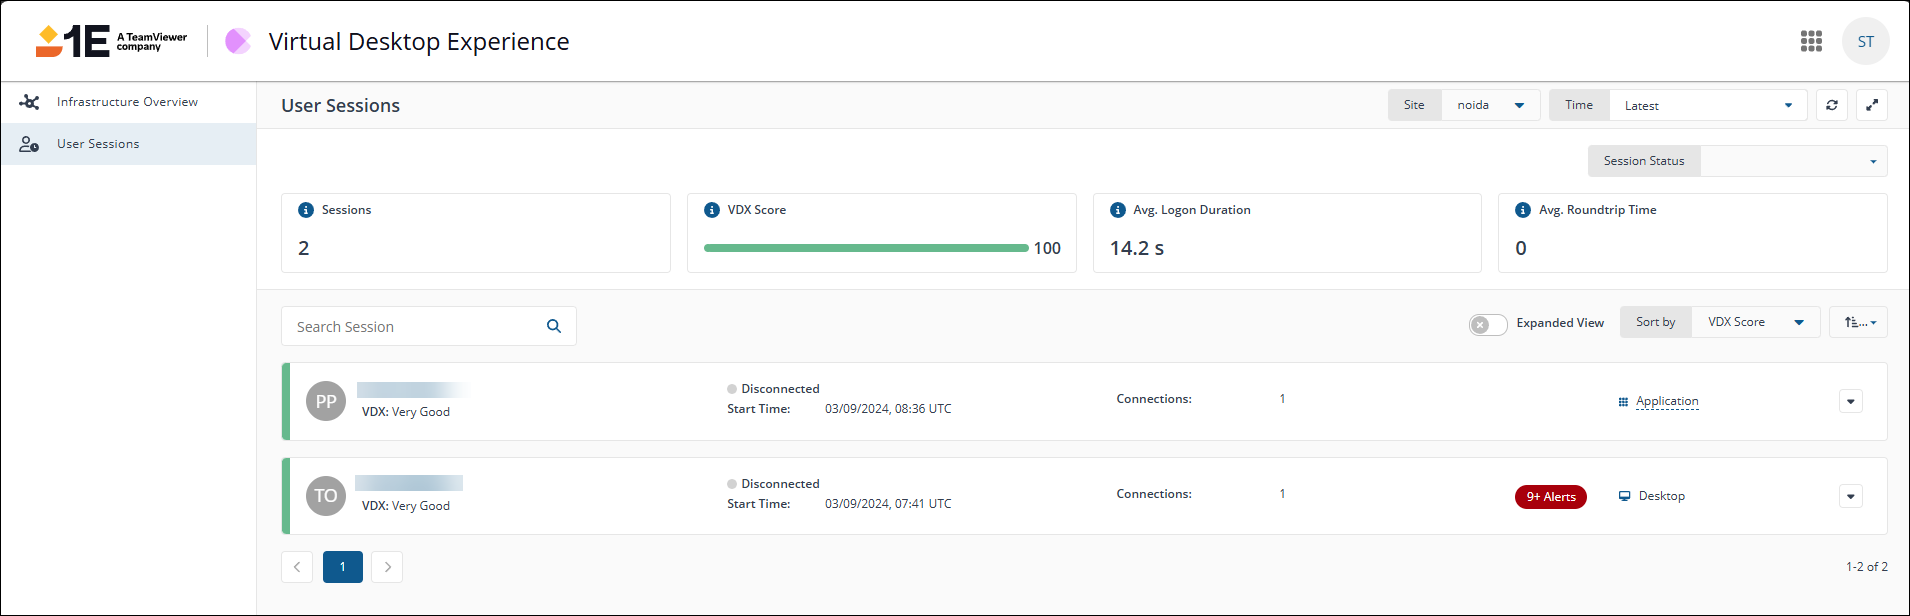
User Sessions dashboard
The User Sessions dashboard displays high level details around all sessions, as well as the ability to filter and sort based on different parameters, and then view individual sessions.
Metrics and KPI
At the top of the page are four main KPIs useful for VDI:
- Sessions: This is the total number of user sessions that are or were live in the infrastructure, based on the applied filters.
- VDX Score: The Virtual Desktop Experience Score is calculated for the matching sessions by combining their logon durations, roundtrip times, drop-offs, auto-reconnects, and device loads that impact each session.
- Average Logon Duration: Logon duration is the time it takes for a user to have an interactive virtual session. This metric represents the average logon duration of all live sessions in the selected site.
- Average Roundtrip Time: Roundtrip time is the delay between the moment a user presses a key and when the response is displayed. This metric represents the average roundtrip time of all live sessions in the selected site.
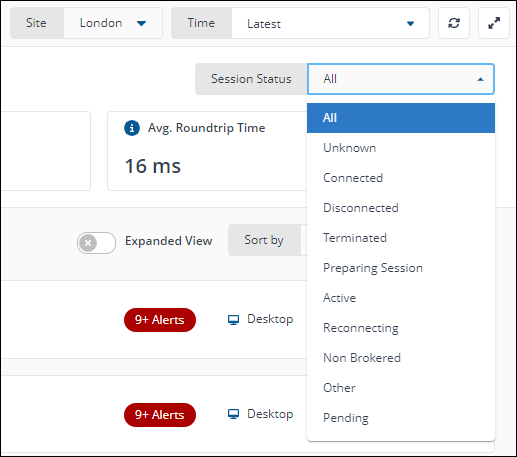
Page options
There are a number of options available at the top of the page.
|
Option |
Description |
|---|---|
|
Site |
You can select which Citrix Site you are viewing the VDI deployment for. |
|
Time |
Use the Time drop-down menu to view the infrastructure topology at a previous moment in time. The Time option allows you to go back up to 7 days. |
|
Refresh |
The Refresh button can be used to refresh the page. |
|
Fullscreen |
The Fullscreen button can be used to maximize the view, removing the page header and left-hand navigation bar from view.
|
|
Sessions Status |
Use Sessions Status to filter the entire page by the status of that session.
|
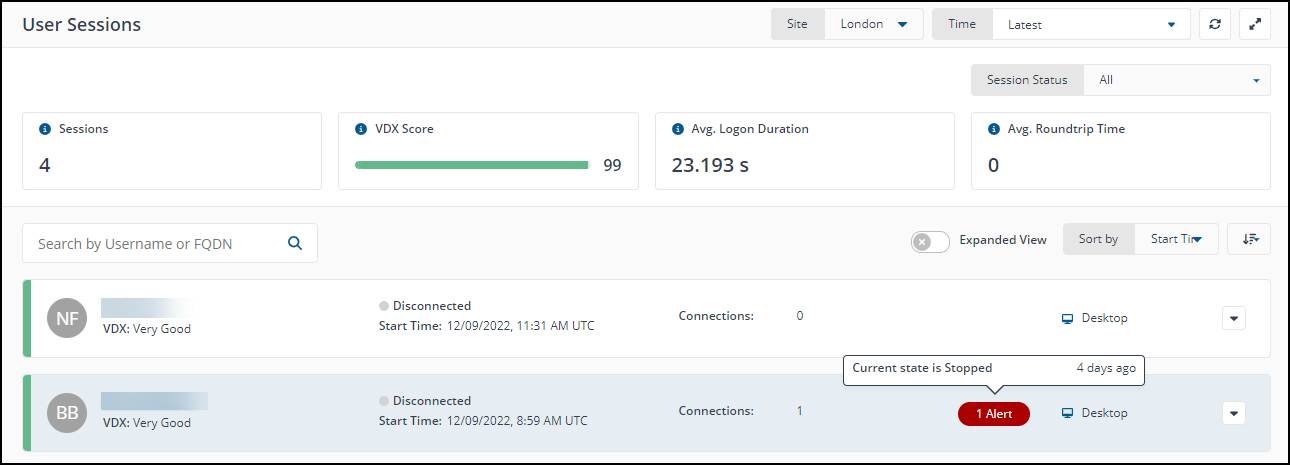
User sessions list
In this section you can view a list of sessions. You can filter, sort and access the following options:
- Search: You can search for sessions using the name of the user, and FQDN.
- Expanded View: You can expand the view to show additional detail per session on the list.
- Sort By: You can sort by numerous options including VDX Score, Start Time, Session Duration, Connections, Logon Duration, Roundtrip Time.
- Sort Ascending/Descending: Use this button to sort the above ascending or descending.
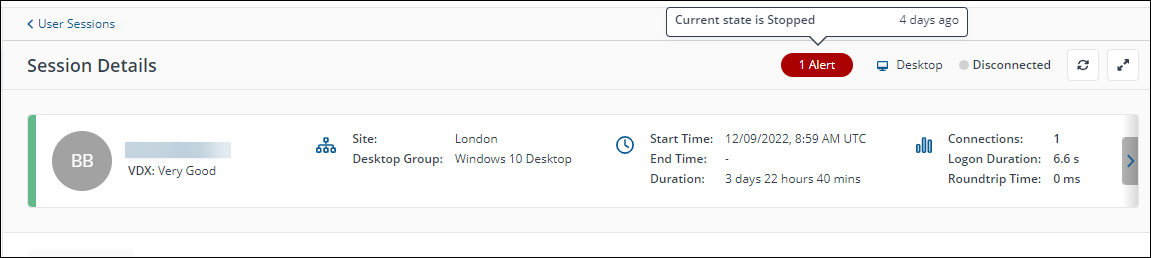
Below these options, you can view a the list of user sessions. This includes numerous key bits of information, including visibility of alerts. Click into a row to view that session in detail in its own Session Details page.
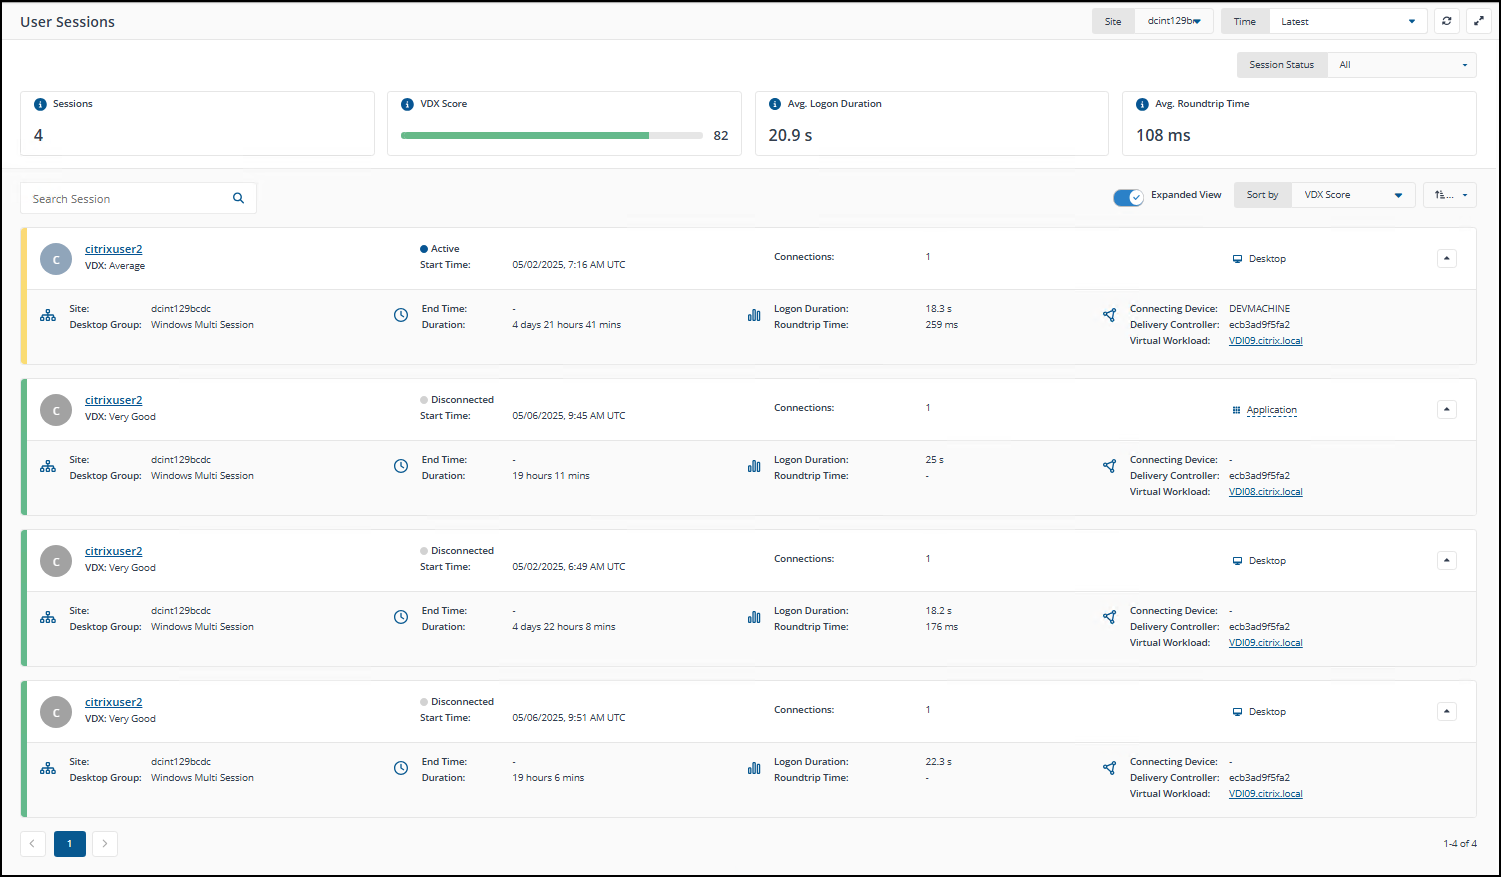
Sessions will display a red alert chip showing the total number of alerts if any connected component, such as the device, Hypervisor, or Virtual Workload, has triggered an alert at any point from session start to end (or to the current UTC time for active sessions). Hovering over the chip will show the alert reason and the time of alert.
User Session Details
This page shows additional information around a specific user session, including the VDX score, Desktop Group, when the session started, it’s duration, logon duration, and roundtrip time.
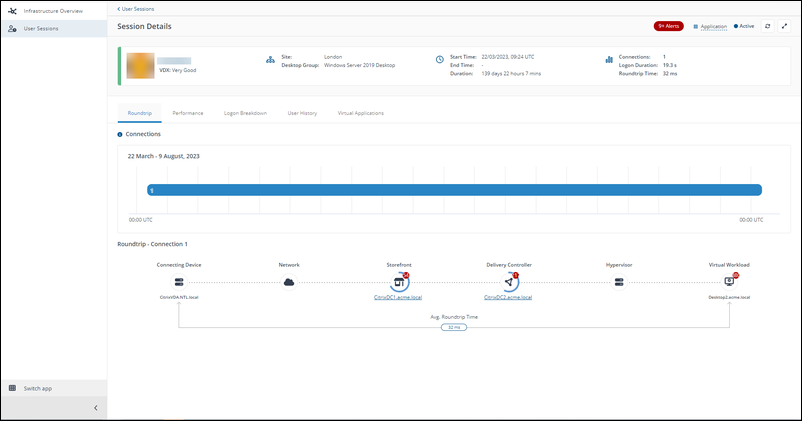
The same alert information is displayed on both the Session Details page and the User Session page.
It also includes number of tabs with additional information:
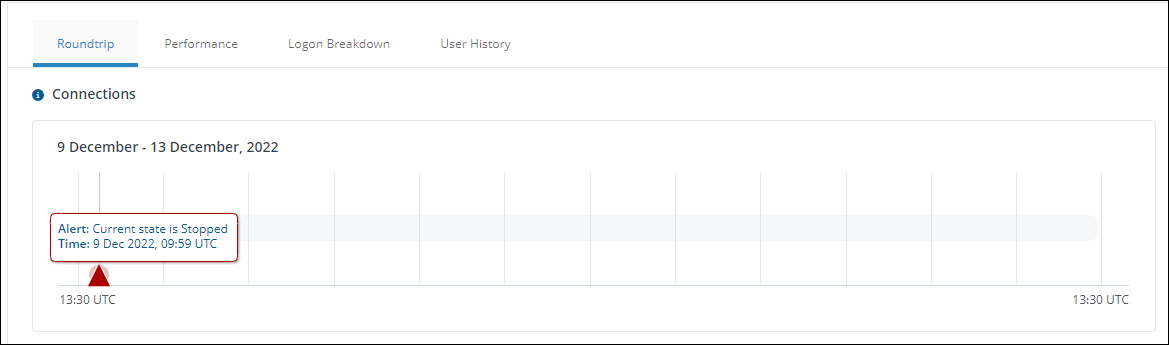
Roundtrip
Displays all the relevant parts of the VDI used to broker that user session.
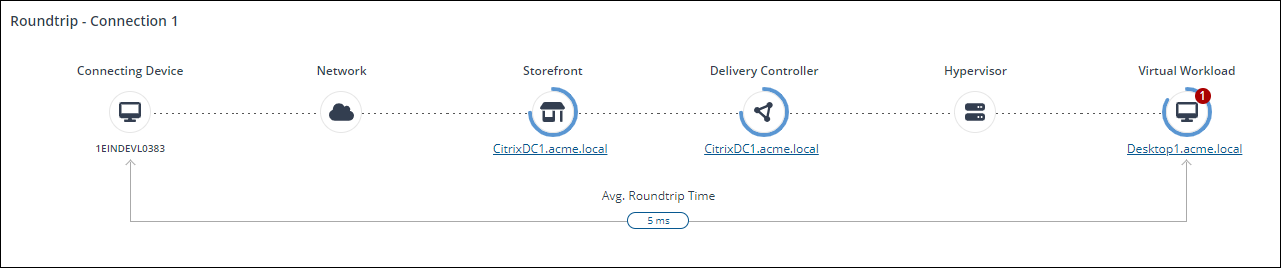
In the Connections section of the Roundtrip or Performance tab on the Session Details page, a red triangle will indicate the time an alert was raised by any node involved in the session, such as Connecting Device, StoreFront, Delivery Controller, Hypervisor, or Virtual Workload, between the session start time and the selected point in time. Hovering over the red triangle will display the alert reason and the exact time the alert occurred.
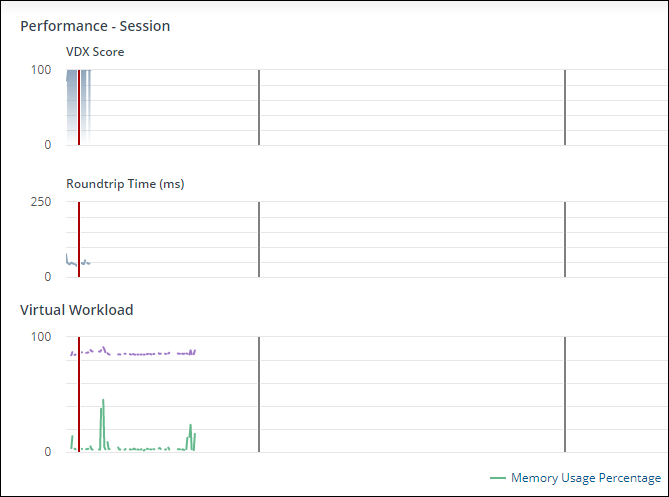
Performance
Each graph on the Performance tab of the Session Details page displays a red vertical line to indicate the time an alert was raised by any node involved in the session, such as Connecting Device, StoreFront, Delivery Controller, Hypervisor, or Virtual Workload, between the session start time and session end time (or the current UTC time for active connections).
When a specific connection is selected, the date range shown will span from the connection start time to the connection end time (or current UTC for active connections).
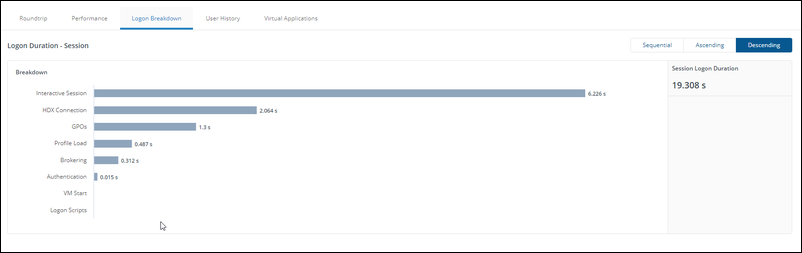
Logon Breakdown
Shows the breakdown of how long different elements of the logon process took. For example GPOs, profile load, authentication, and more.
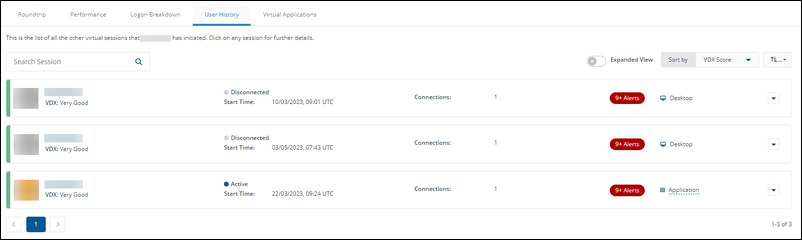
User History
Displays previous sessions for that user, going back up to 28 days.
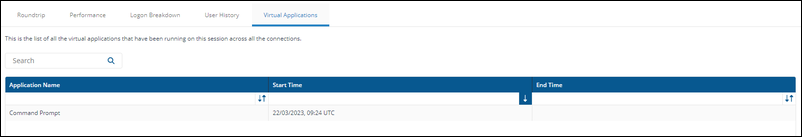
Virtual Applications
View published applications running as part of this session, across all connections.