Insights
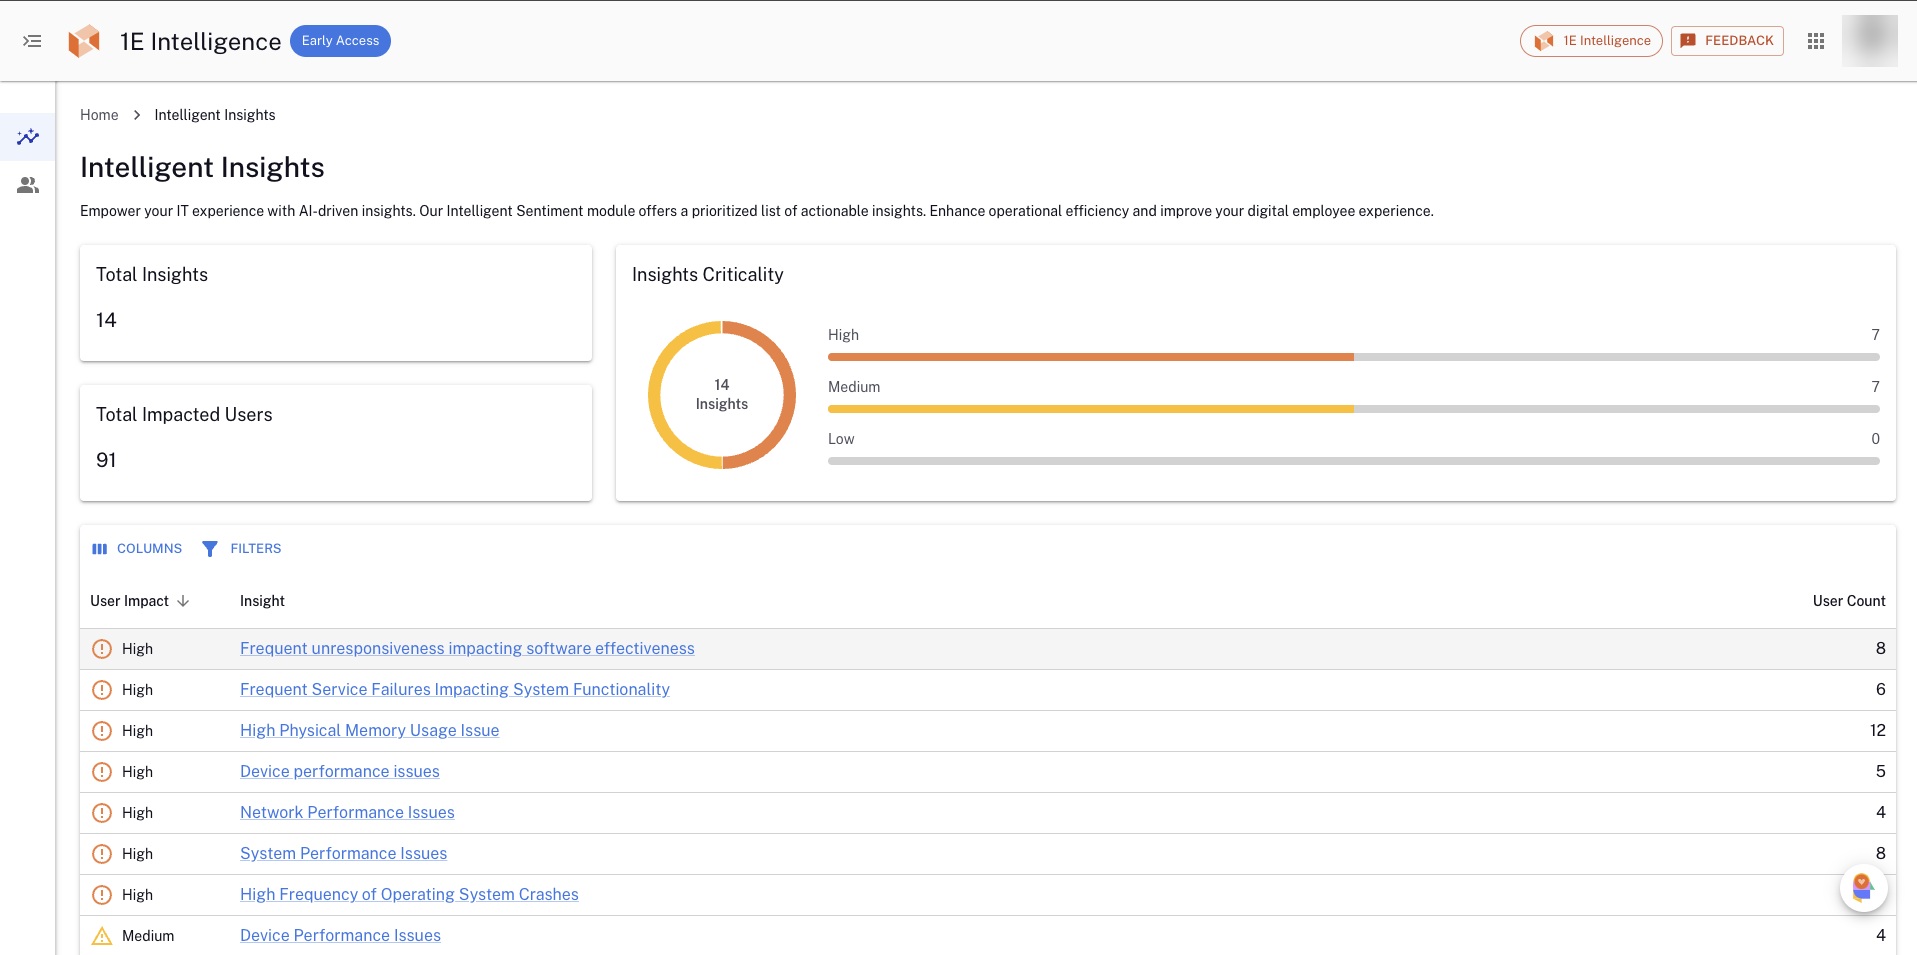
Insights provides improved visibility over emerging issues that are impacting users and devices. By leveraging AI-driven analysis of anomalies, outliers, and trends, the Insights dashboard provides an early-warning system of problems that may negatively impact user experience if you do not remediate them. In addition, the feature provides human-readable analysis of gathered data, potential root causes, and clear recommendations on the next steps you can take.
New insights are generated every 24 hours, starting at 2 AM UTC. Insights are retained for 14 days.
Some Intelligent Insights are AI-enhanced, based on data from your account. Please use your judgment and verify important details independently. Feedback on AI content is appreciated to improve its quality.
Insights dashboard
The Insights dashboard consolidates repeated occurrences of the same issue into a single aggregated insight, providing IT teams with a clearer, more actionable view of digital experience problems. Instead of displaying multiple duplicate alerts, it presents one unified entry per unique issue, covering occurrences within a rolling 14-day window.
The Insights dashboard includes the following:
- Widgets: Capture an instant overview of the following:
- Insights: The total number of insights open in your account, created in the previous 14 days. The graph displays the number of devices impacted over the last 14 days.
- High User Impact: The number of insights that have a significant impact on the user.
- Top Impacted Tags: The total number of insights, categorized by tags, that have impacted device performance.
- Top Insight Types: The total number of insights, categorized by types, that have impacted device performance.
- Severity Trend: The chart shows the trends based on the severity of issues effecting devices over the past 14 days.
- Latest Insights: The list of insights, including their severity and most recent occurrence.
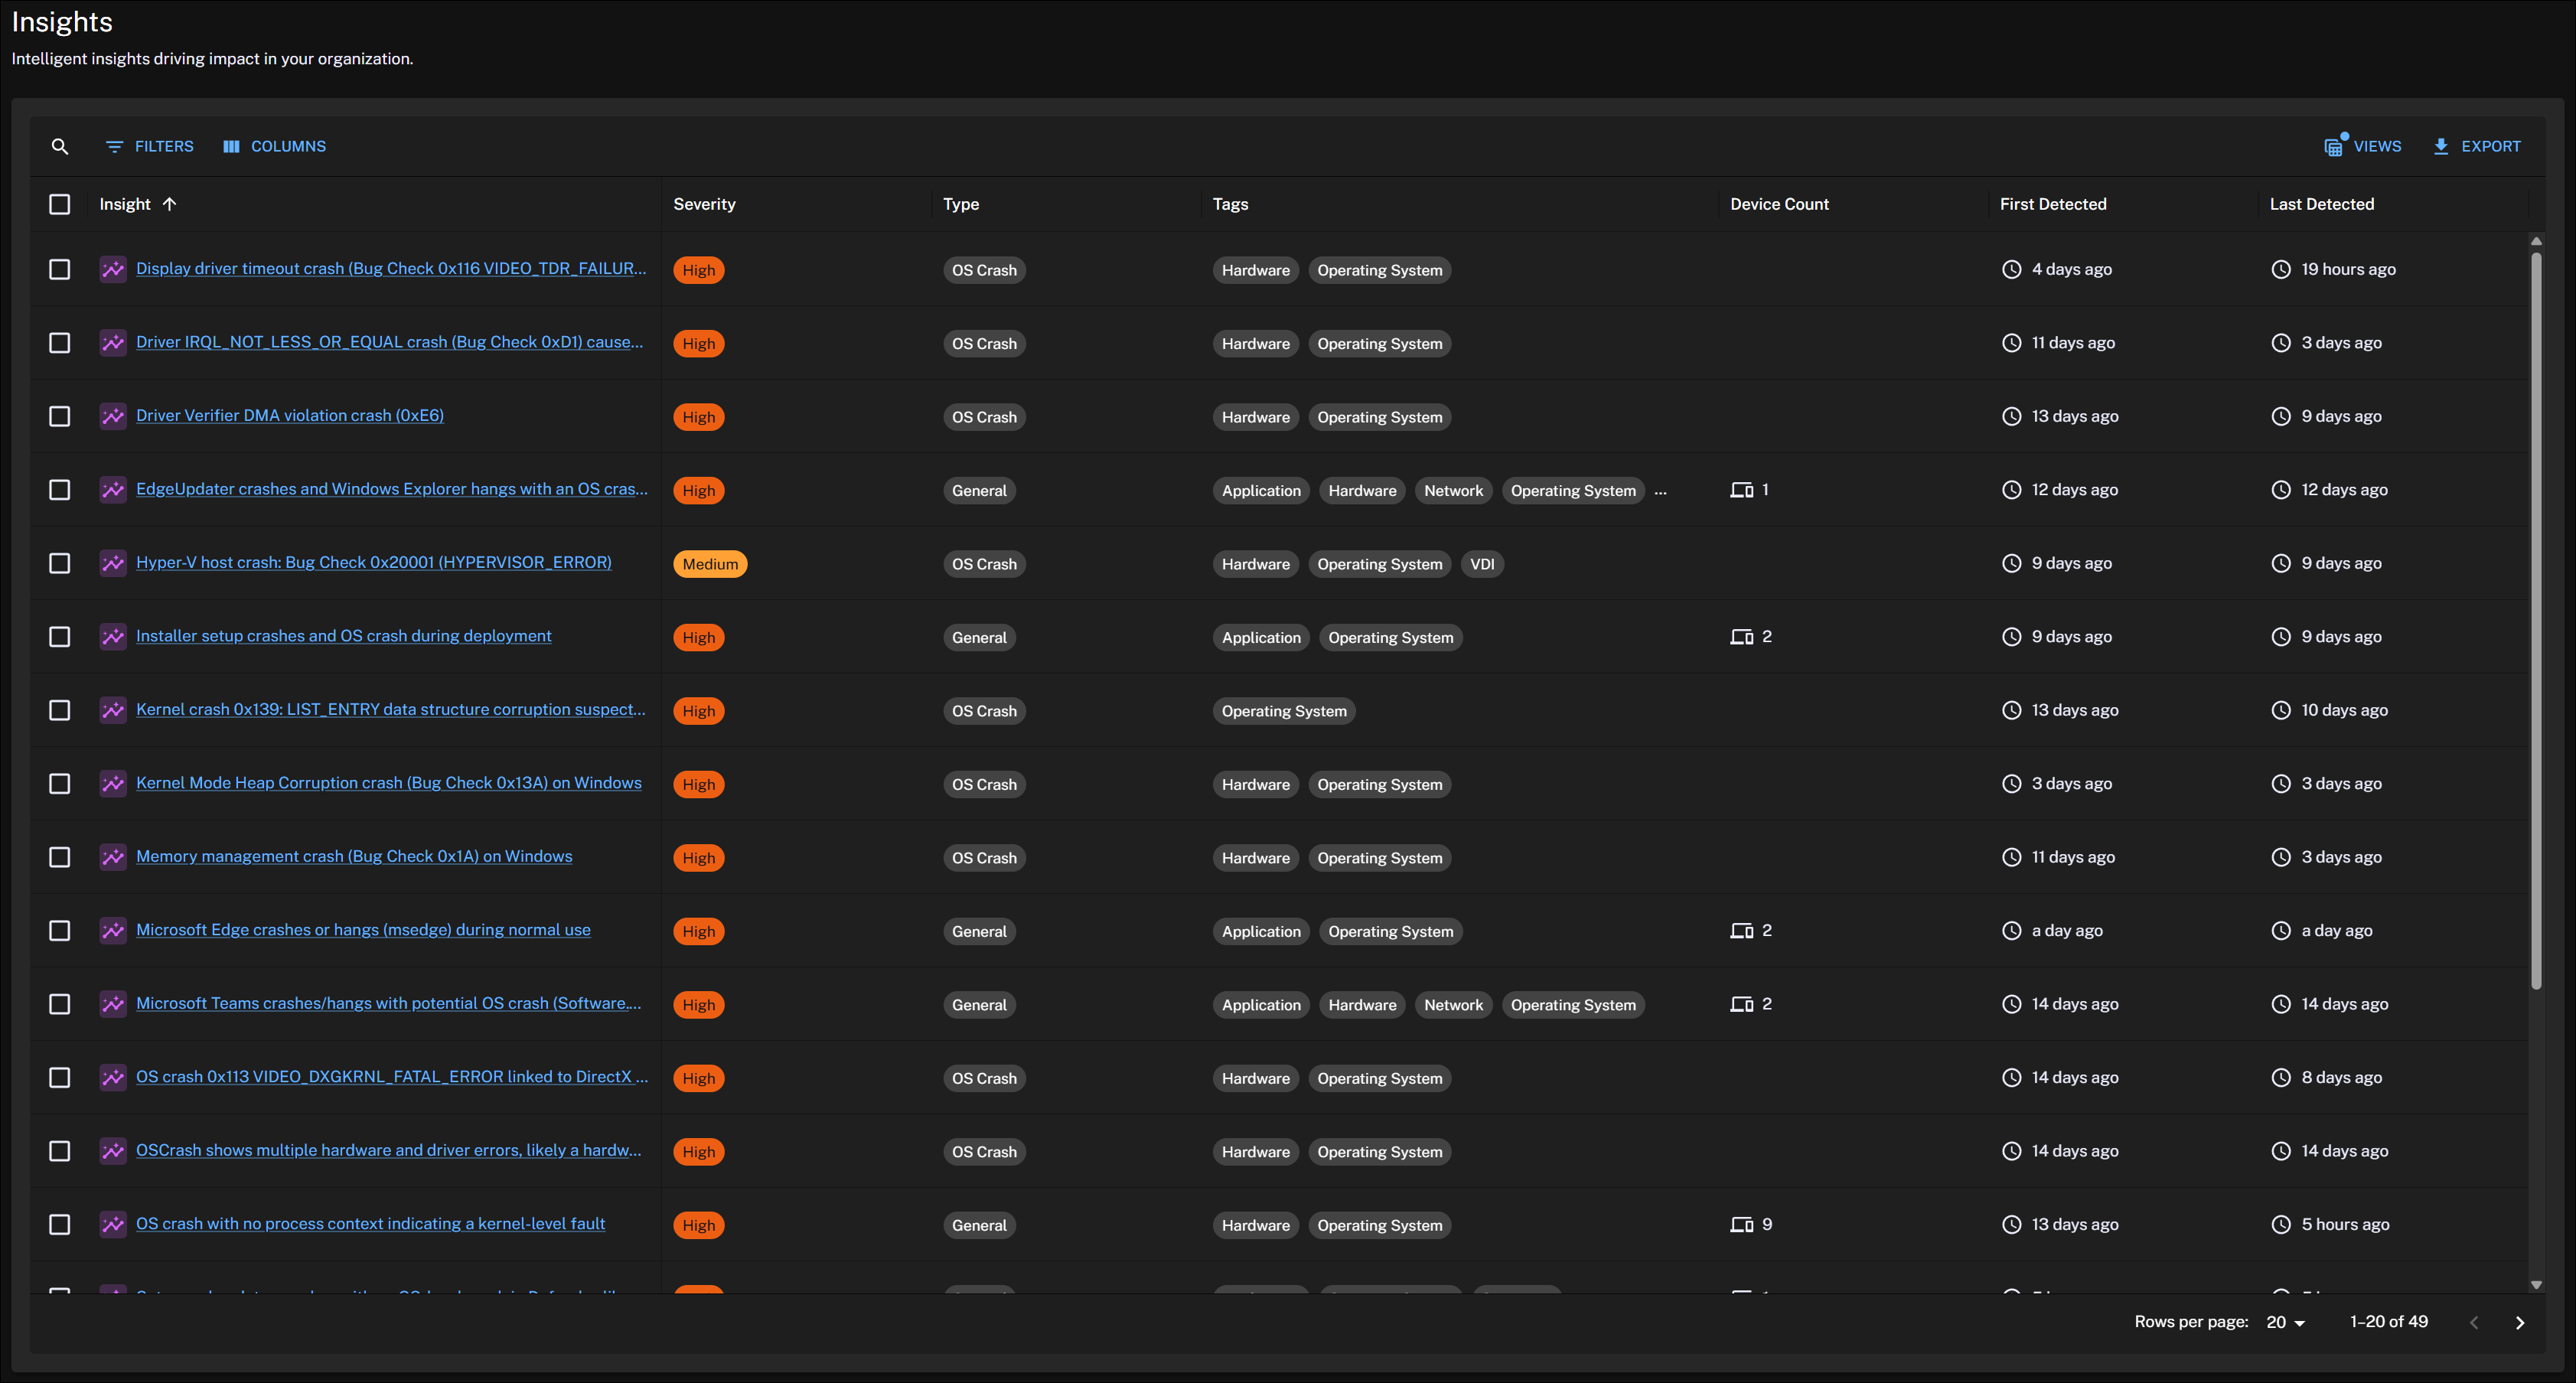
- Insights table: A comprehensive view of your insights, providing an overview and easy access to more details.
Click any widget on the Insights dashboard to view the insights table.
The table provides the details on the severity of each insight, the impacted devices, and the occurrences of issues.
Filter columns by insight, tags, type, device count, first detected, last detected, severity.
Sort by column values.
Add or remove columns using the column selector.
Drill into an insight to review additional details on the Insight Details page.
Insight details
Click an Insight on the Insights dashboard to view its details. You can see the description of the problem, its potential causes, user impact assessment, recommendations, and remediation guidance on what to do next. This page also includes access to the data behind the insight, and a device list.
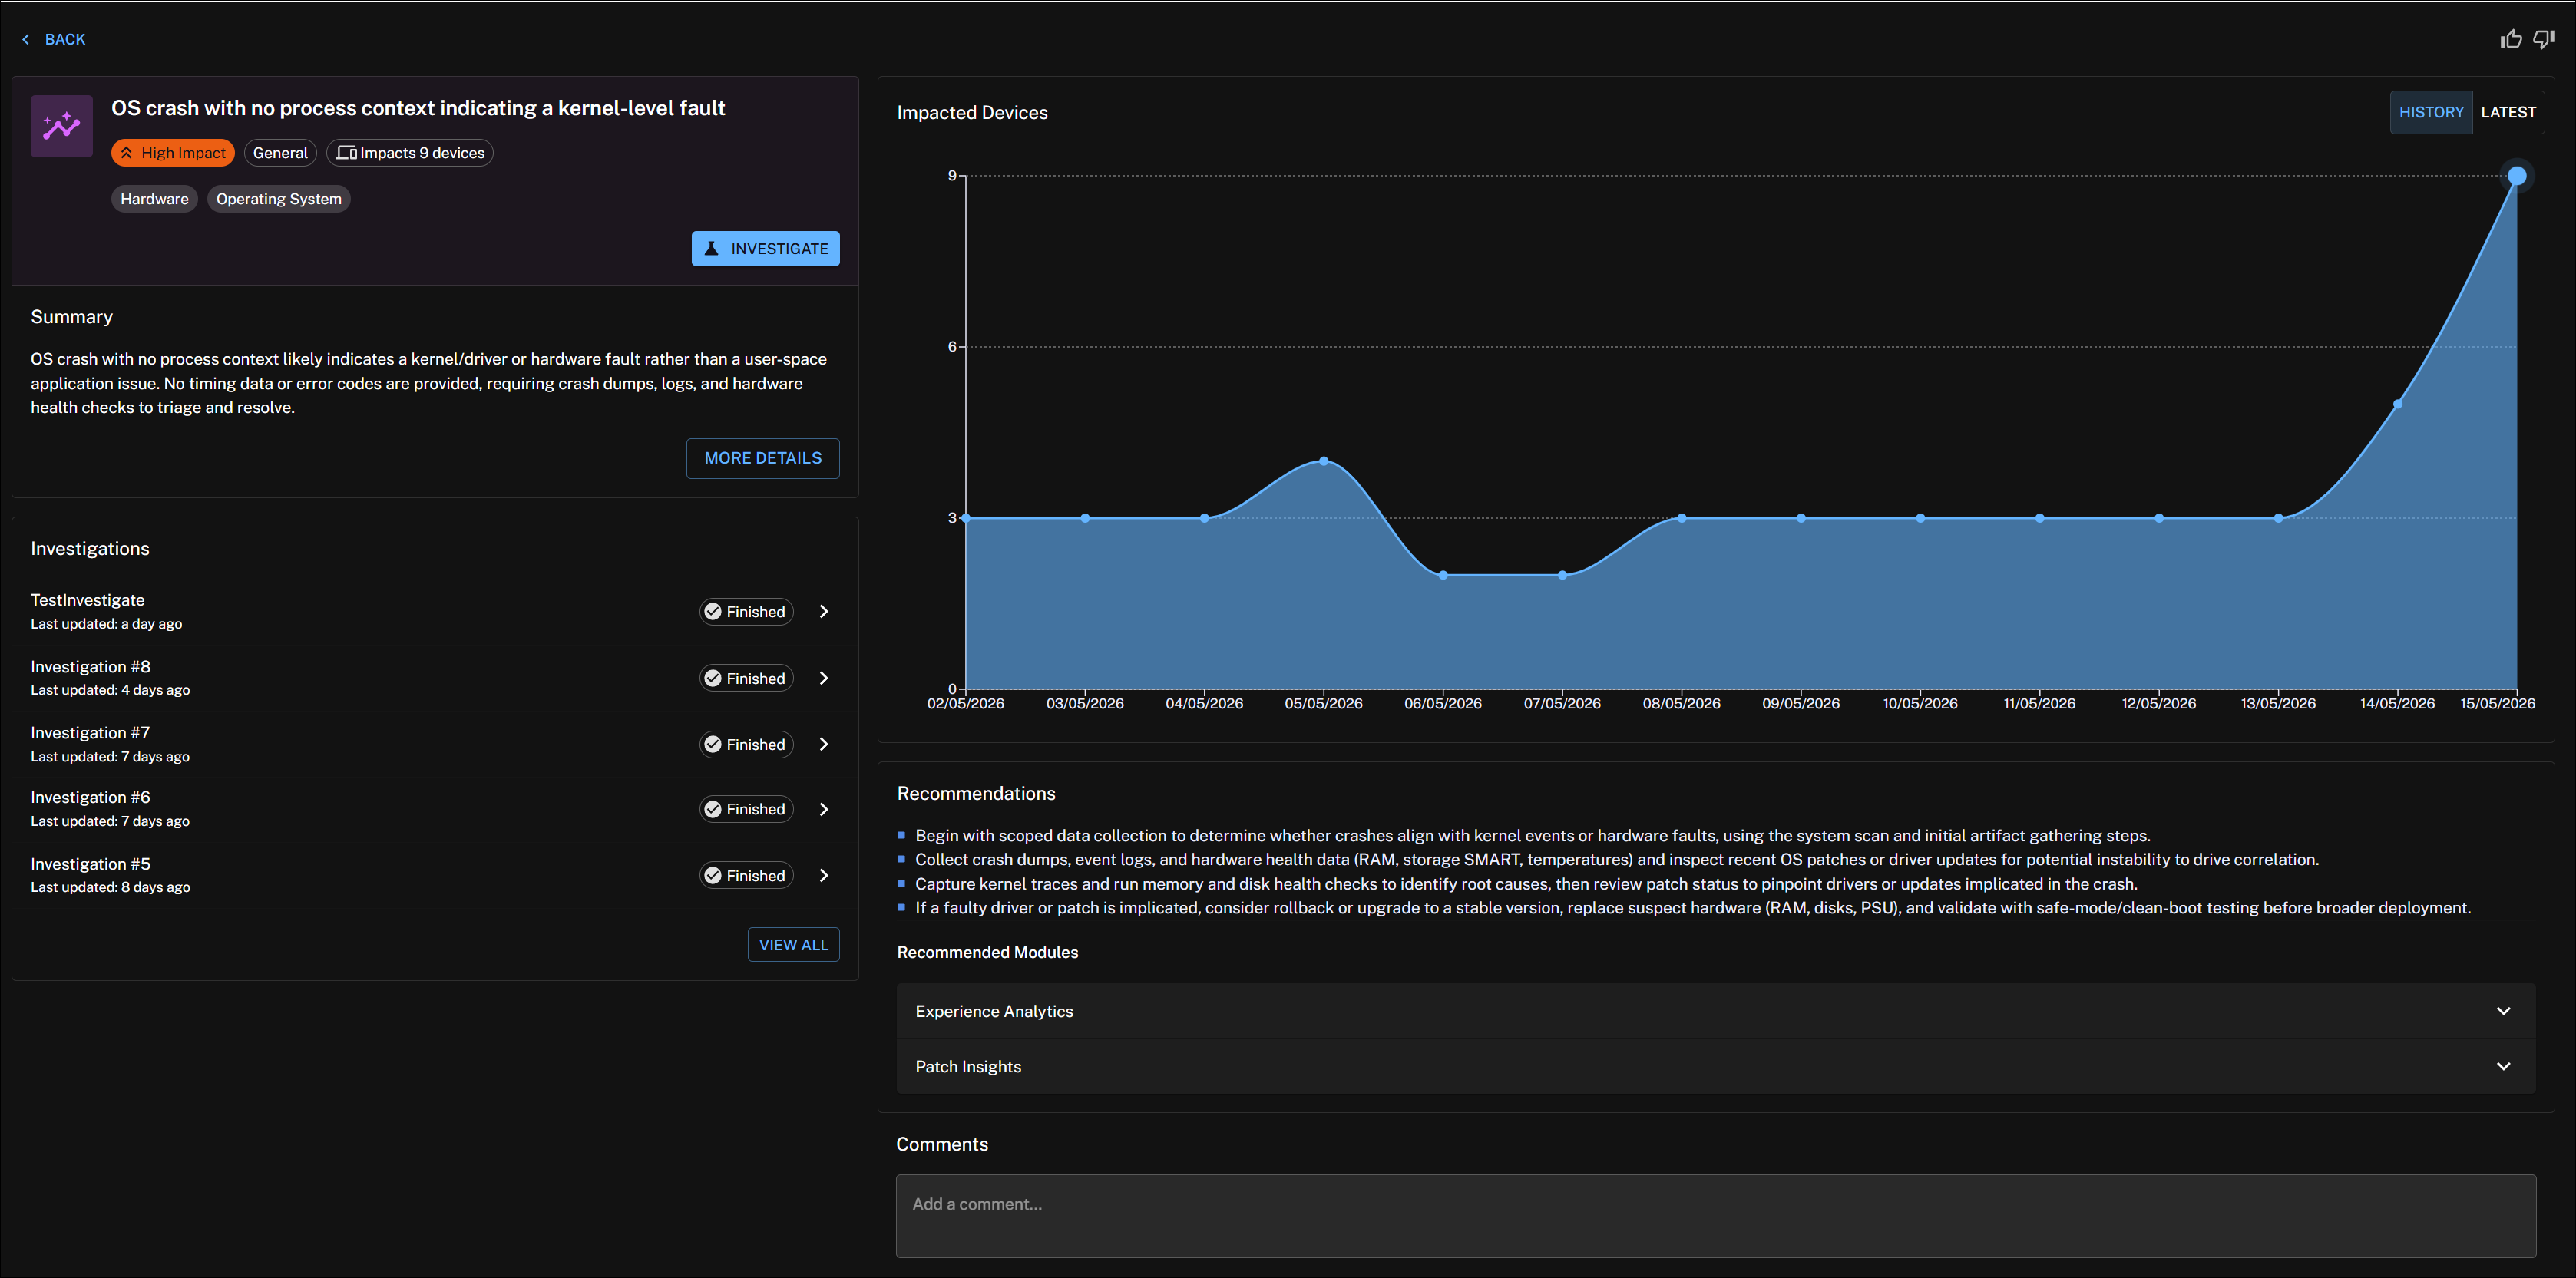
Insight Details includes the following features.
Summary card
Provides you with a description of the problem, impact criticality, insight category, and affected devices.
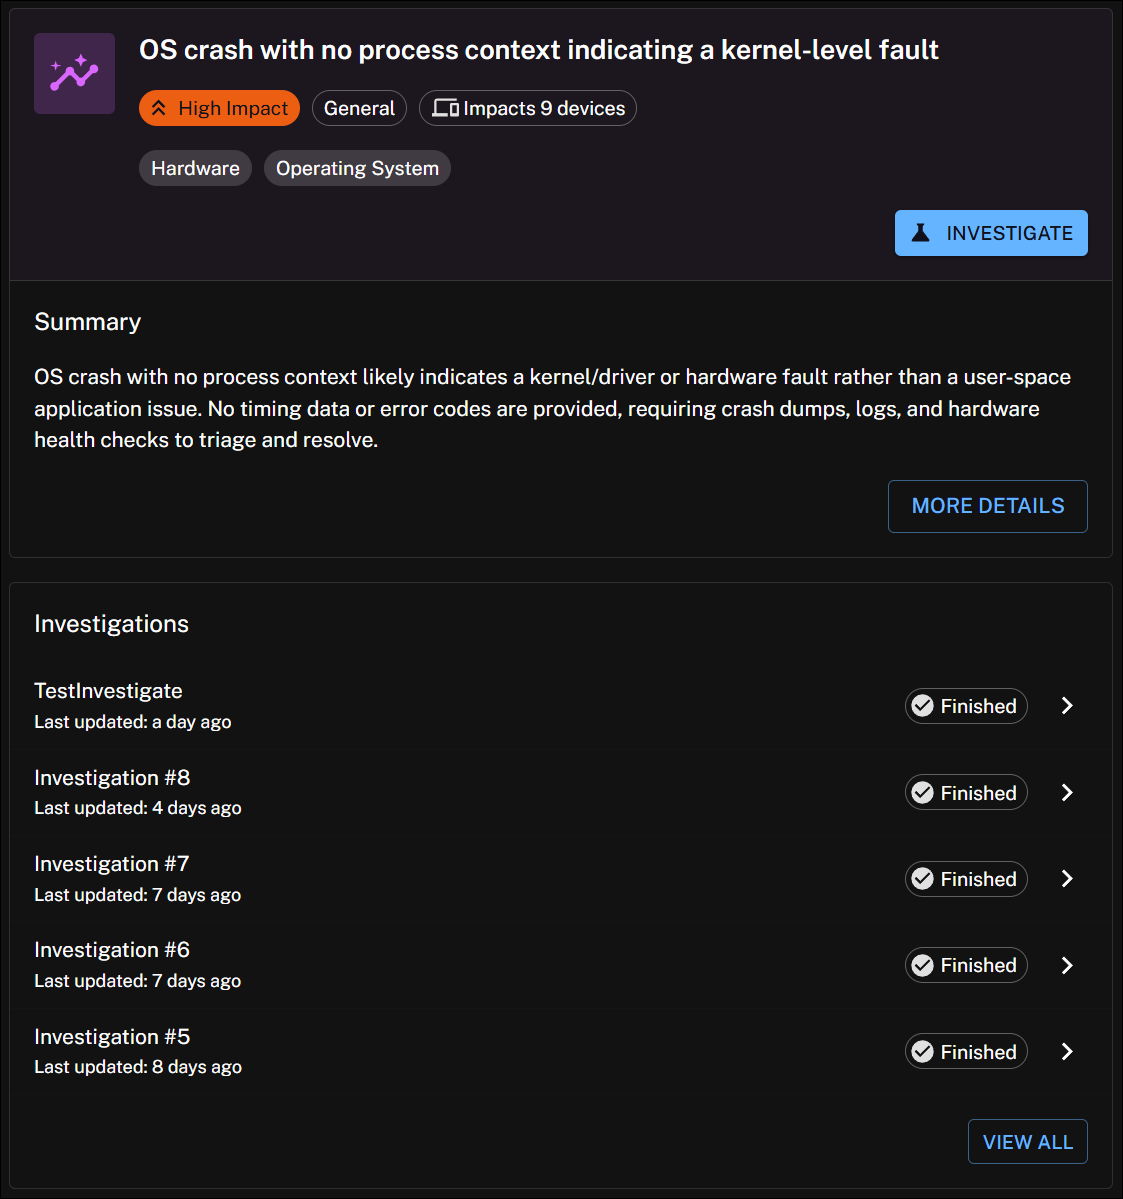
Using the summary card you can view a brief overview of the insight, and investigation history in date order with its status.
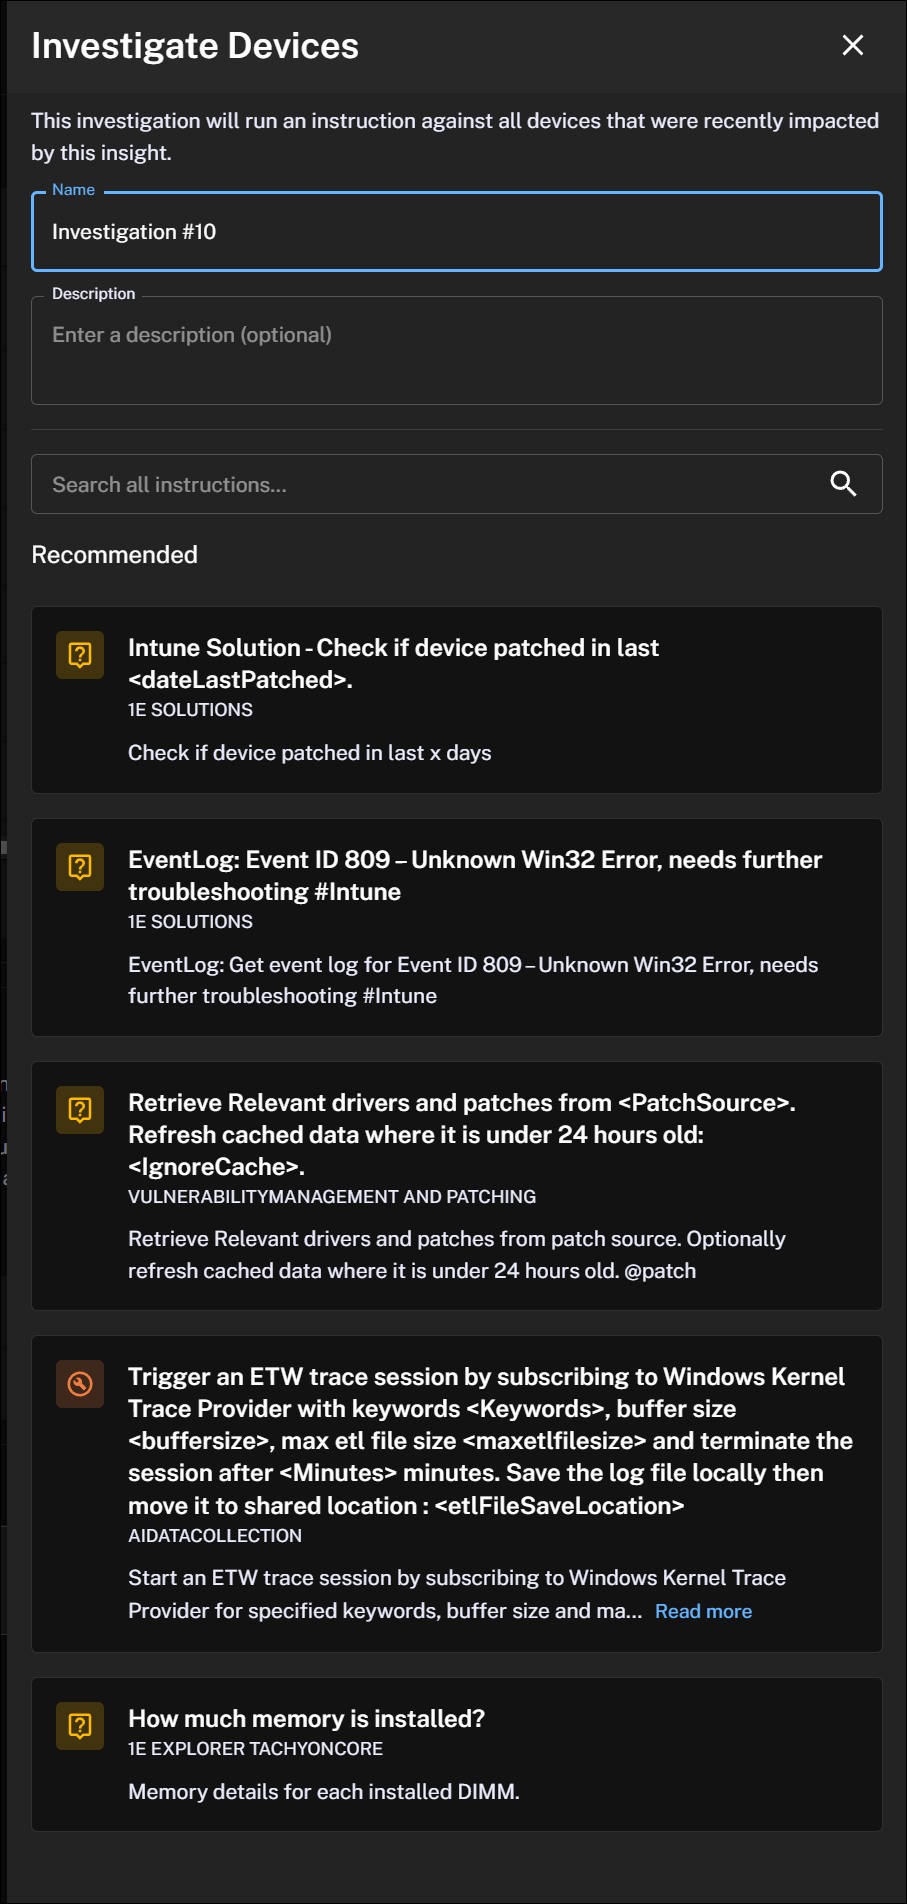
Investigate tab
The Investigate tab opens the Investigate Devices drawer, allowing you to search for and execute instructions along with any recommended instructions. This investigation will run an instruction across all devices impacted by this insight in the past 14 days.
Summary
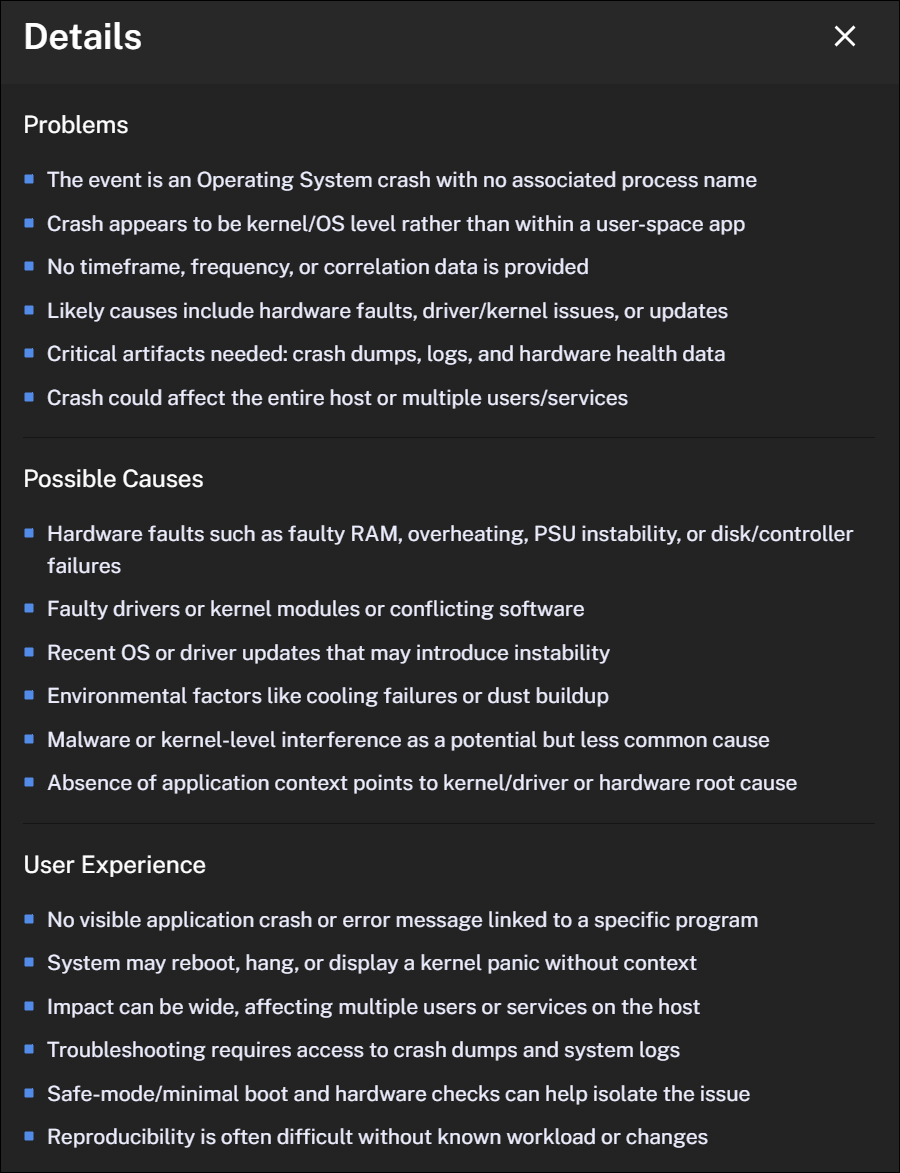
The Summary provides a brief overview of the insight. The More Details drawer provides detailed information, including the problems, possible causes, and related user experiences. These insights highlight specific Platform capabilities related to investigating or resolving issues.
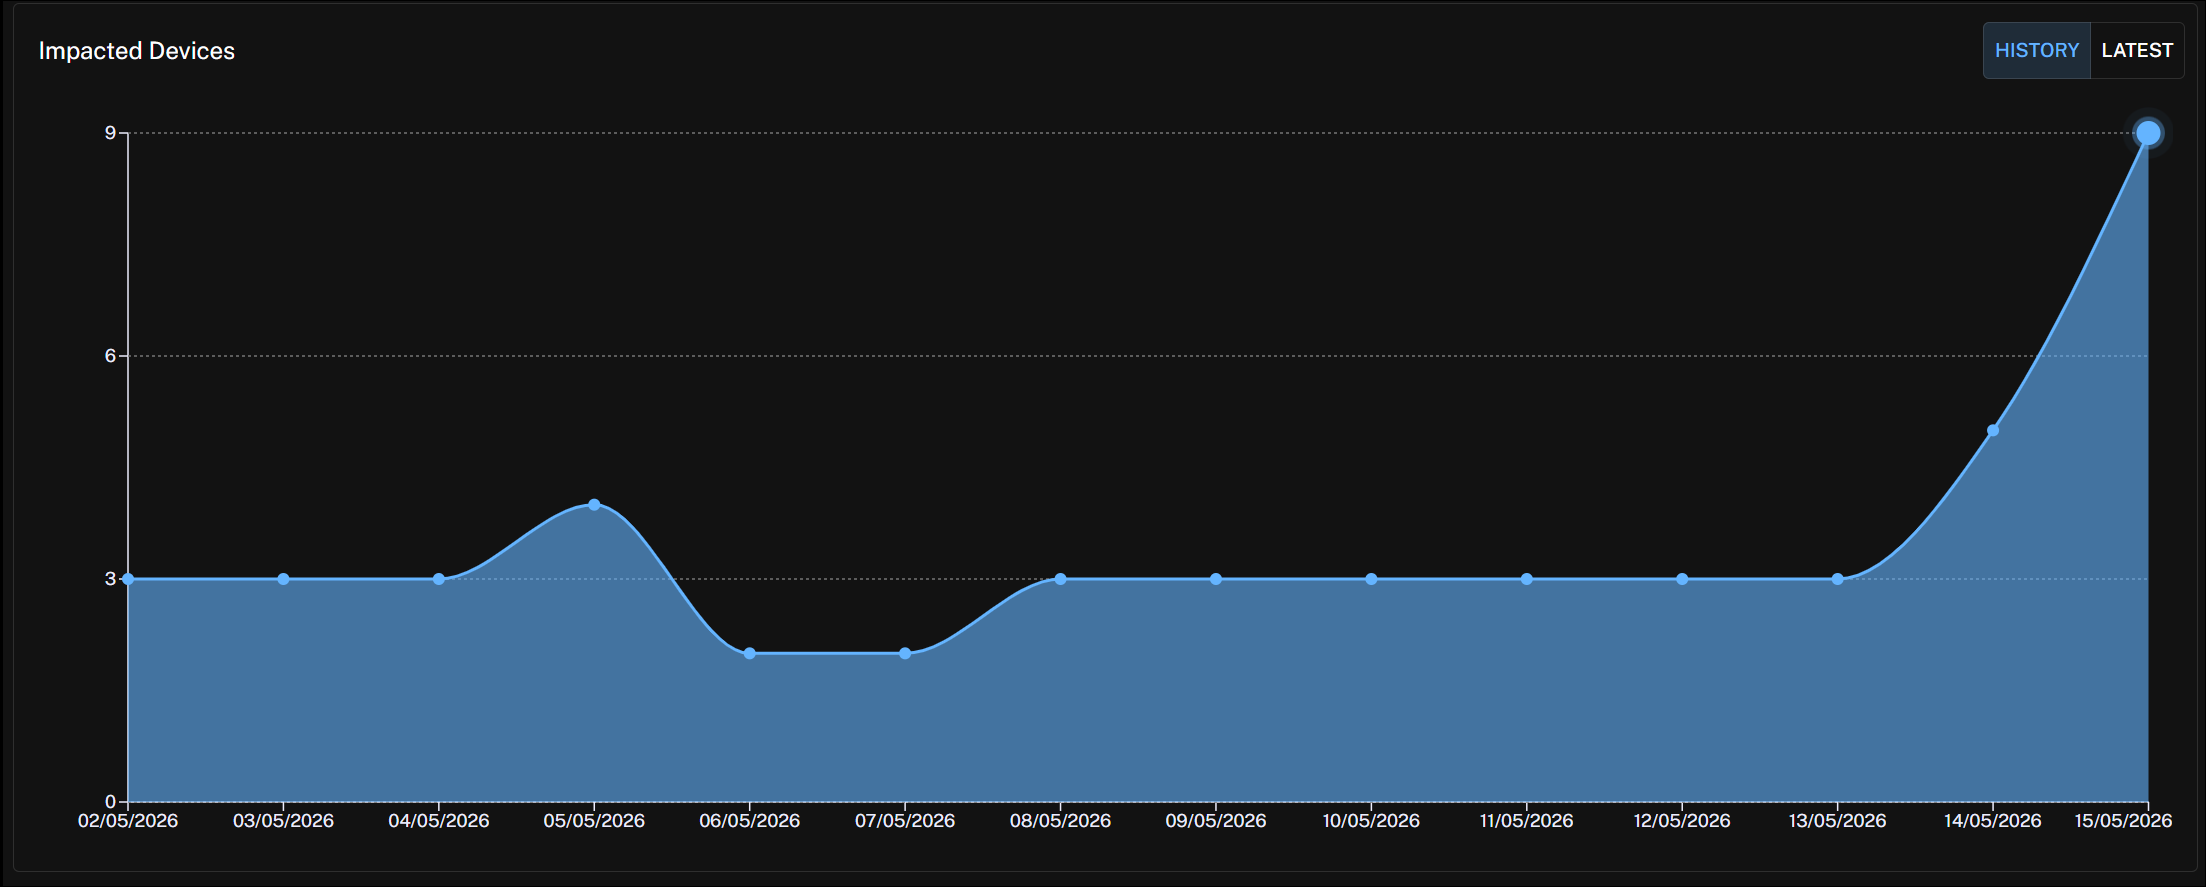
Impacted Devices
Device insights and summary help you quickly detect, diagnose, and resolve device issues, both individual and widespread, using real-time, actionable insights.
Benefits include the following:
-
Faster issue resolution.
-
Early problem detection.
-
Awareness of broader device trends.
-
Improved technician efficiency and user experience.
You can switch between the tabs to view impacted devices. The History tab displays a graph showing impacted devices over the last 14 days. Click any detail in the graph to view the associated devices. To view device-level insights and summary, select a device name.
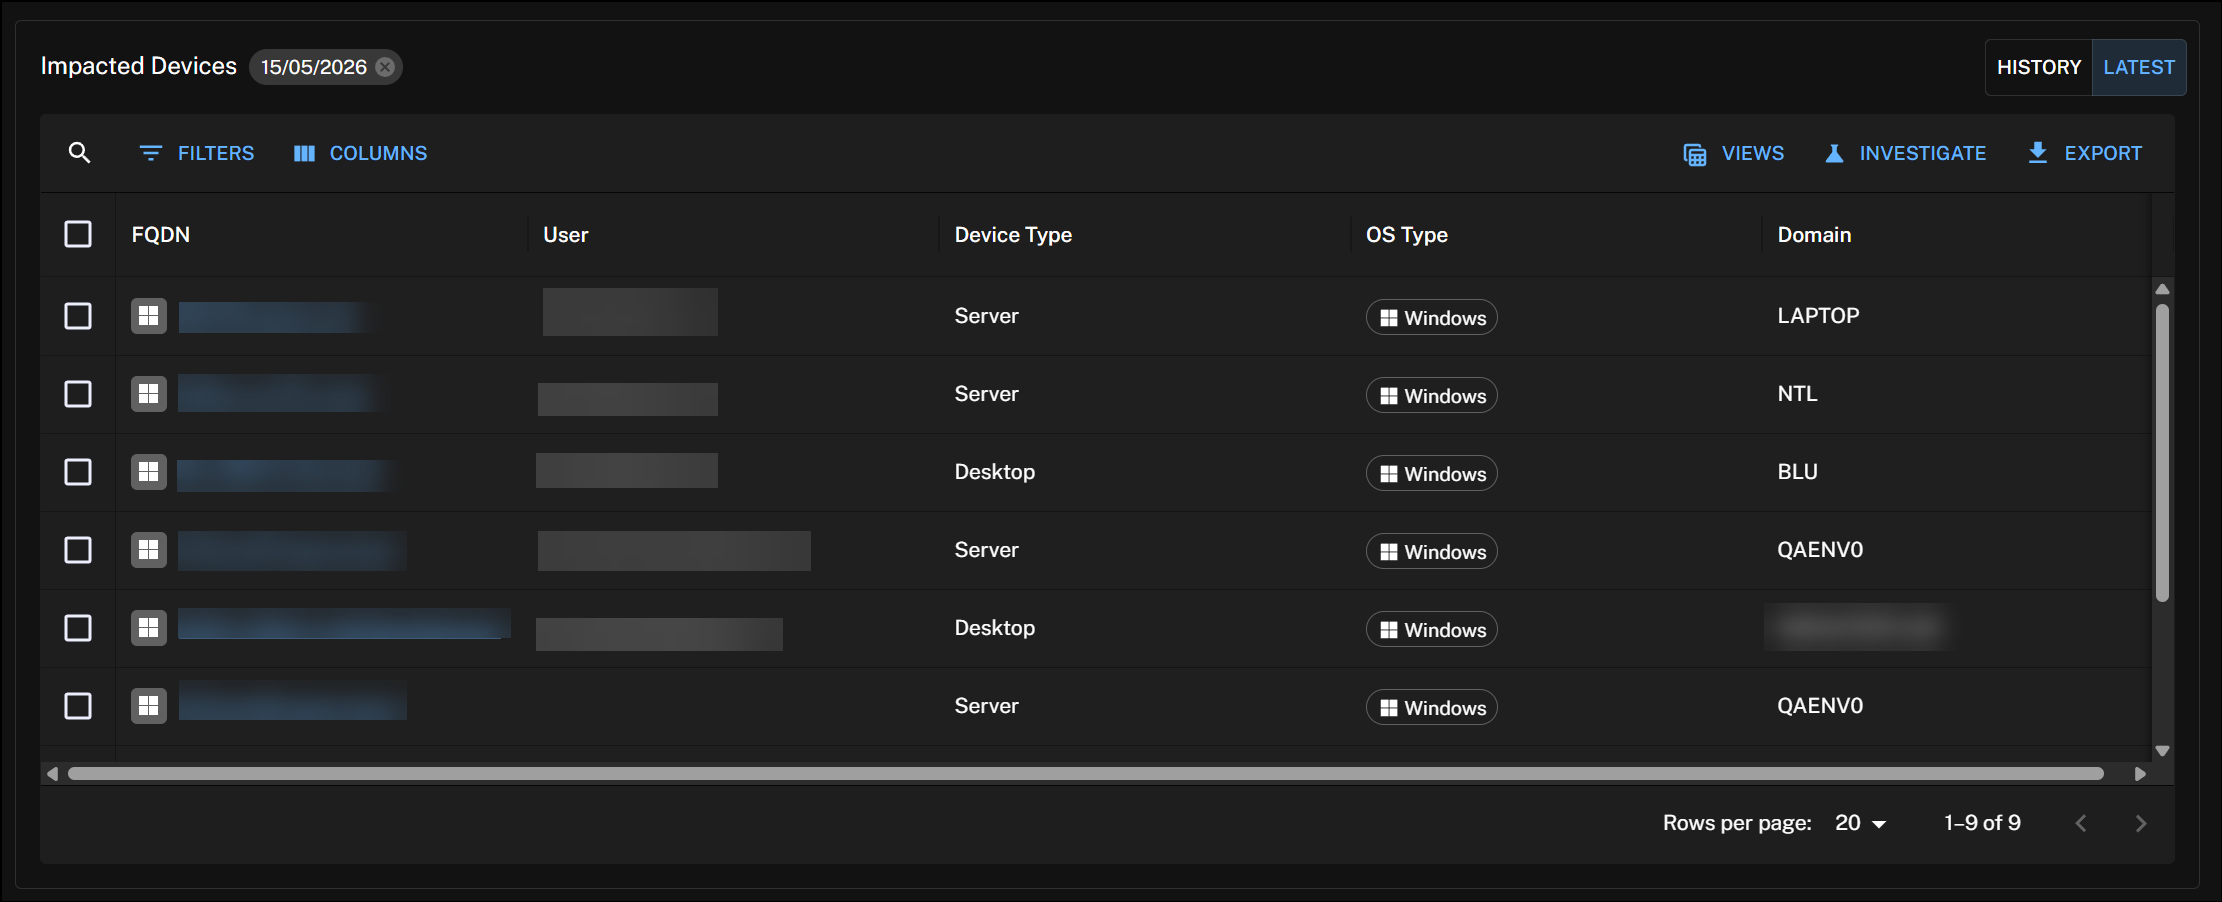
The Latest tab displays a list of impacted devices. Click any device to access events and performance data associated with the insight gathered over the last seven days. To view device-level insights and summary, click a device name. You can select one or more devices to view, investigate and export device details.
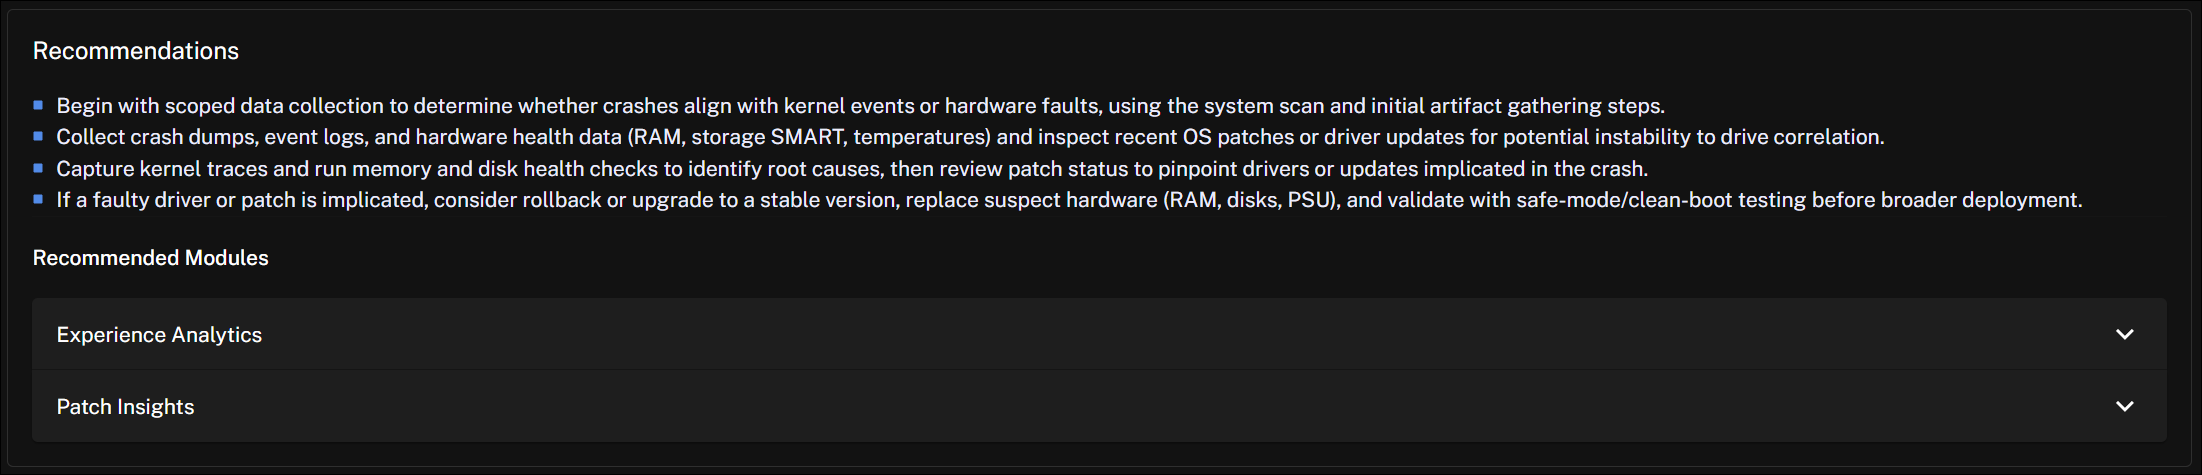
The Recommendations section suggests actions based on previous investigations and remediation activities.
There is a comment section at the bottom of the page. You can add comments directly to an insight, enabling teams to collaborate during investigations, share context and findings, and document decisions or actions taken.
Provide feedback on insights with a thumbs up or thumbs down. Our Data Science team uses this to improve insights quality.
Running instructions and viewing instruction history
You can search for and run an instruction against a set of devices from an Insight page.
To click and open an instruction you need the 1E Intelligence Administrator and All Instructions Questioner roles.
To learn about how to configure Platform users, roles, and management groups, refer to Permissions.
Select an Insight and click Investigate to open the Investigate Devices drawer.
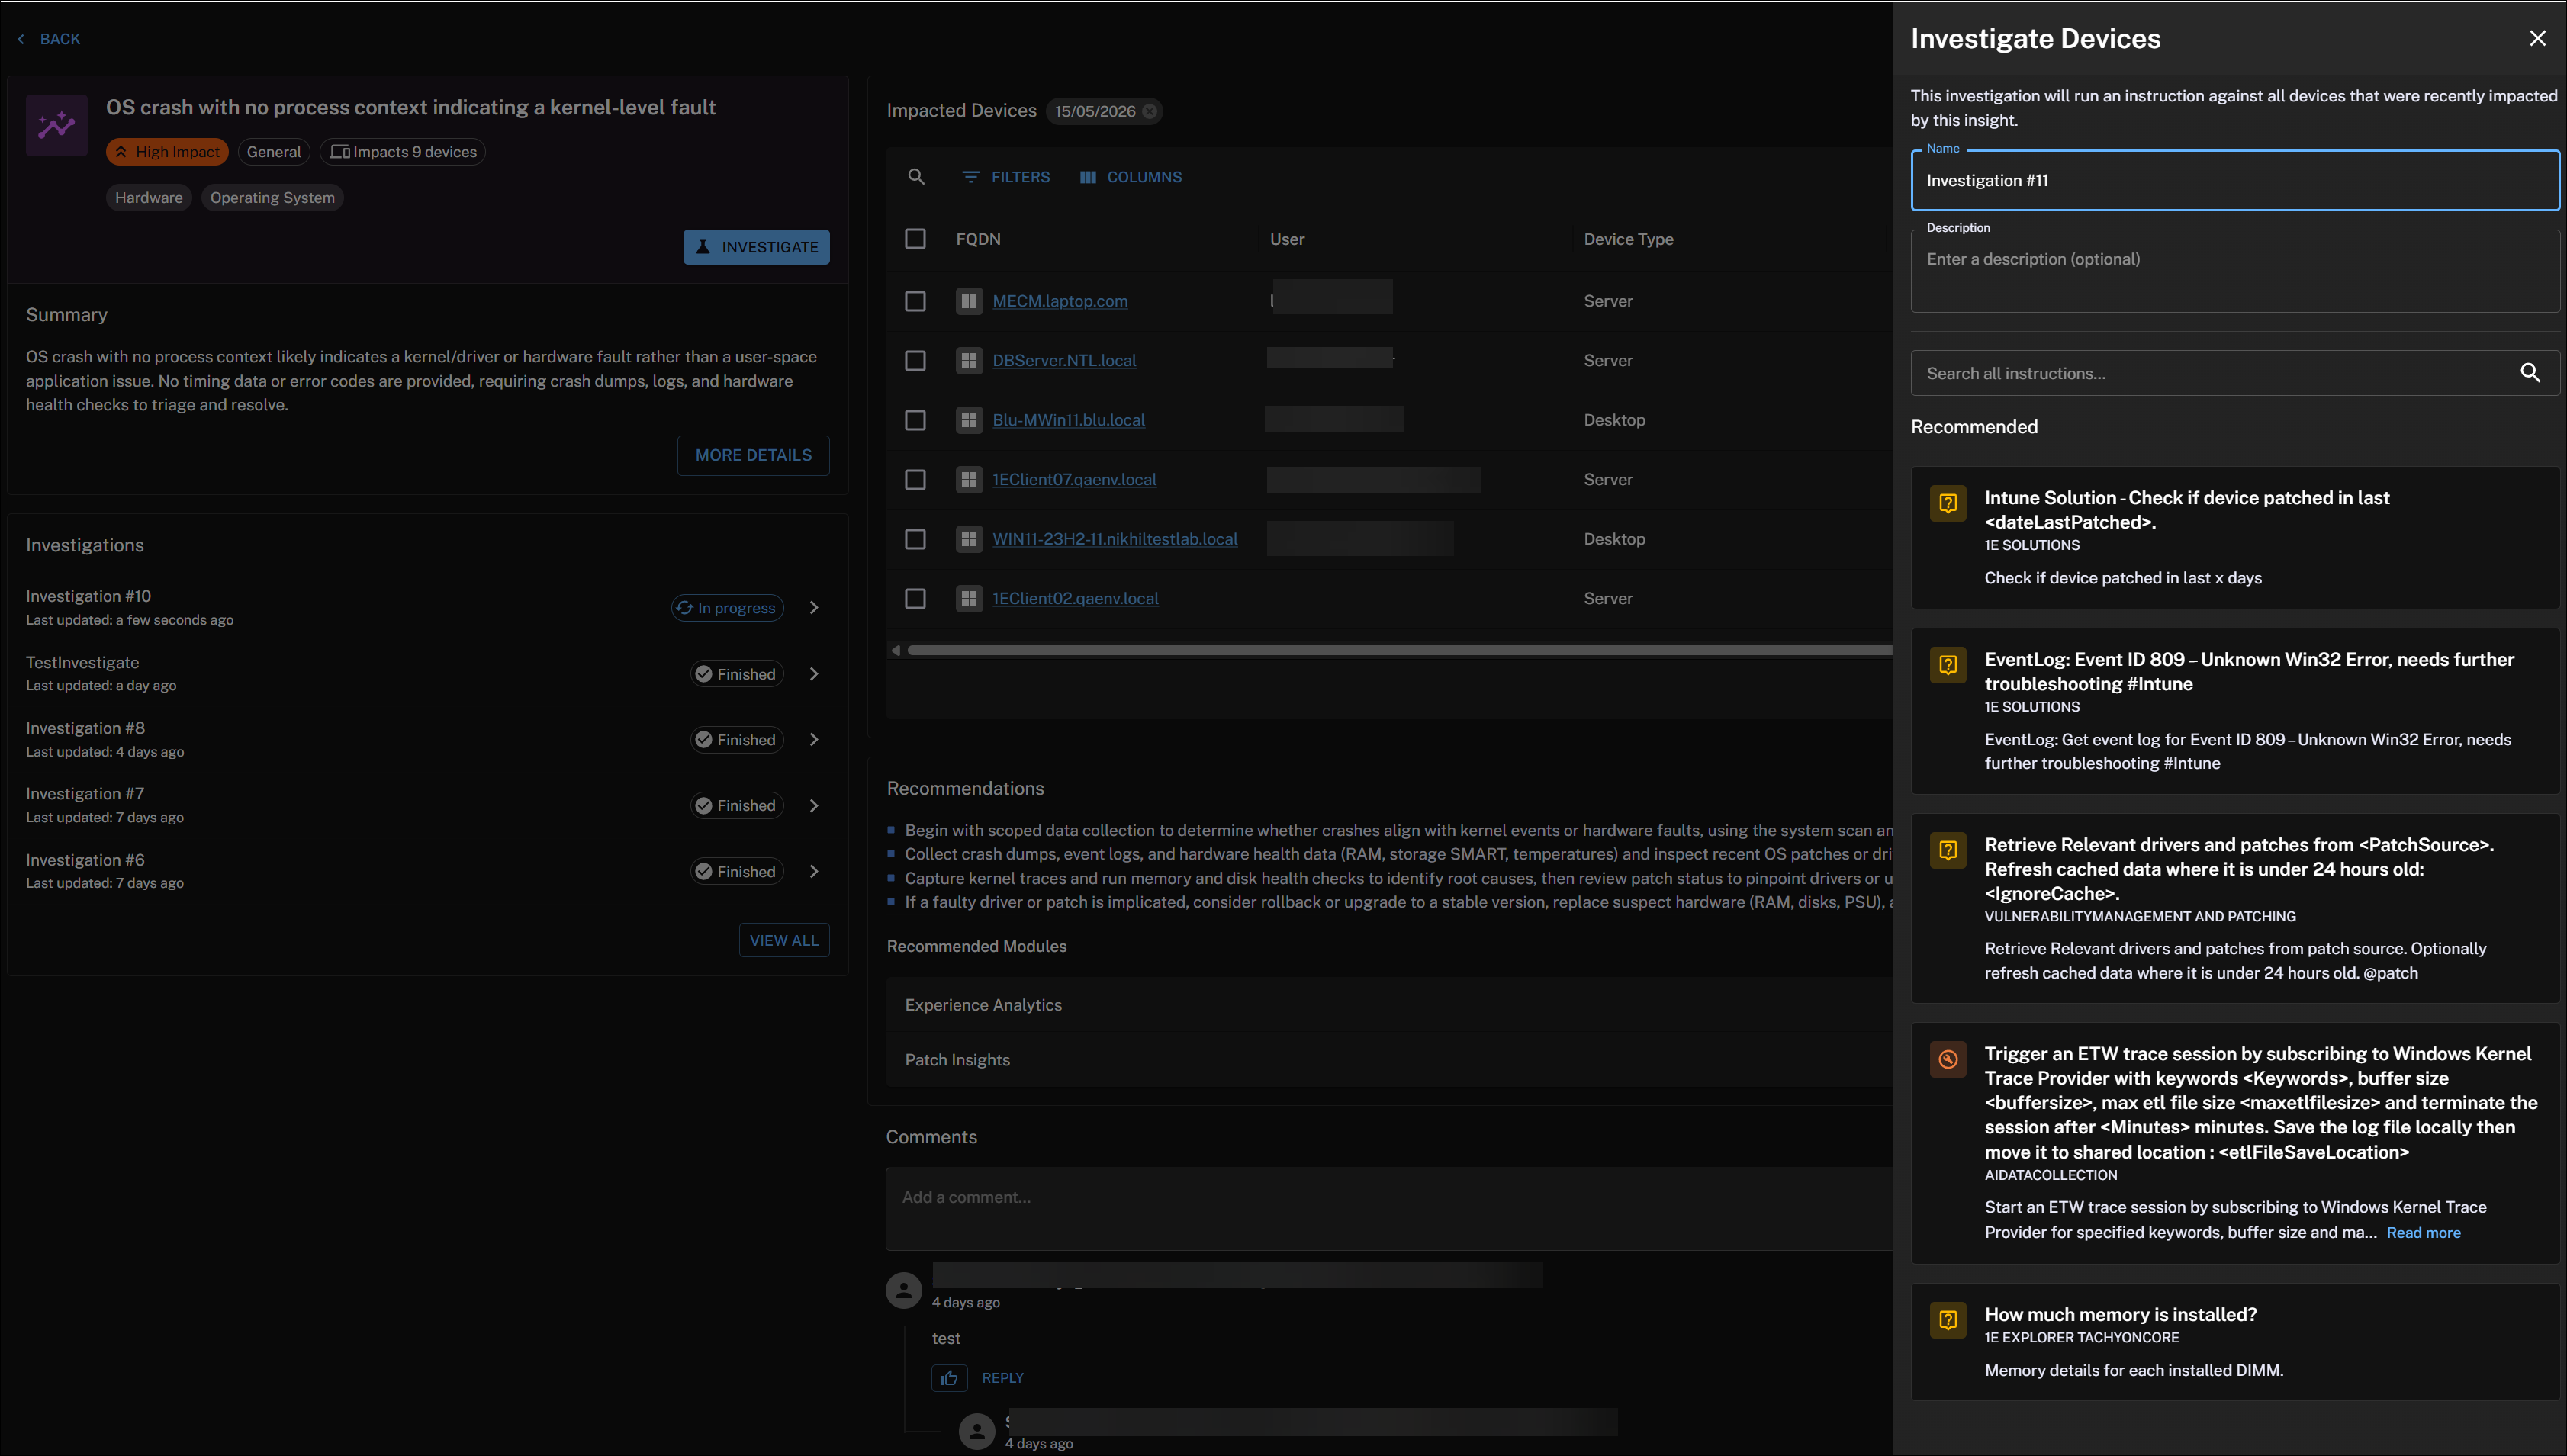
To run an instruction perform the following:
-
From the Investigate drawer, search for an Instruction, or choose one from the list.
-
Click an Instruction to configure its parameters. You can configure every parameter except for coverage. If you navigate away after filling out any part of the form, an unsaved changes dialog will appear. When you have finished editing, click Run Instruction.
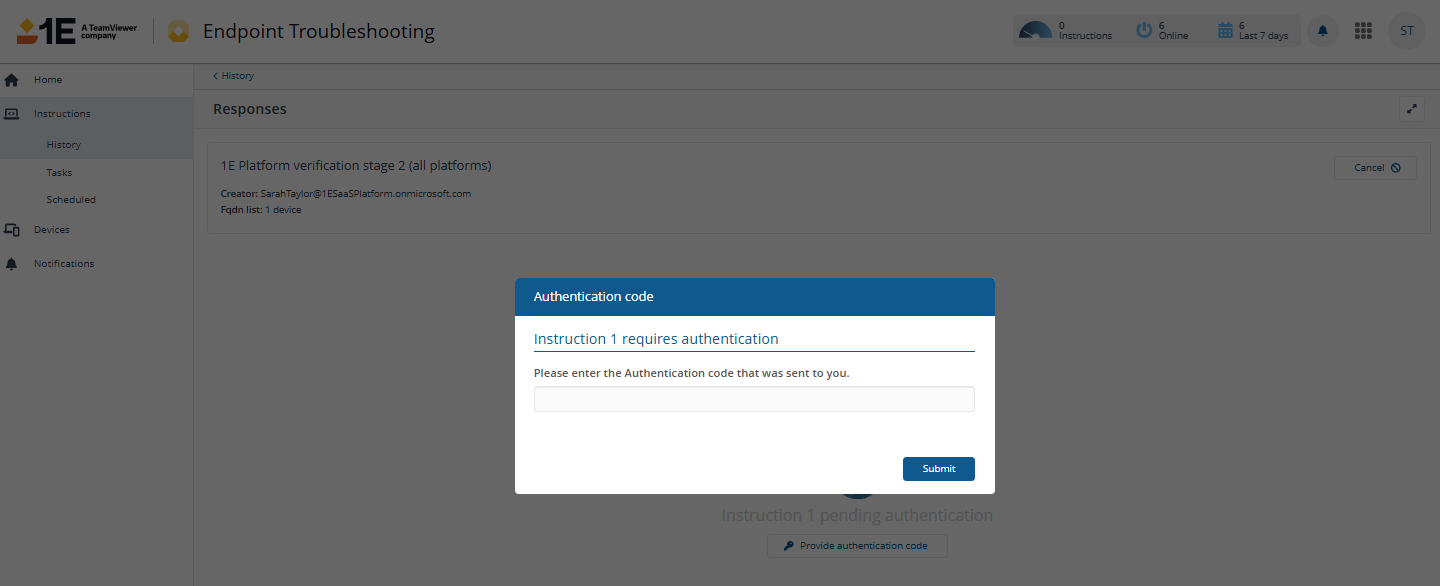
When you run an Action, you will need to follow the approval workflow. Clicking Authentication opens the following page for that Instruction.
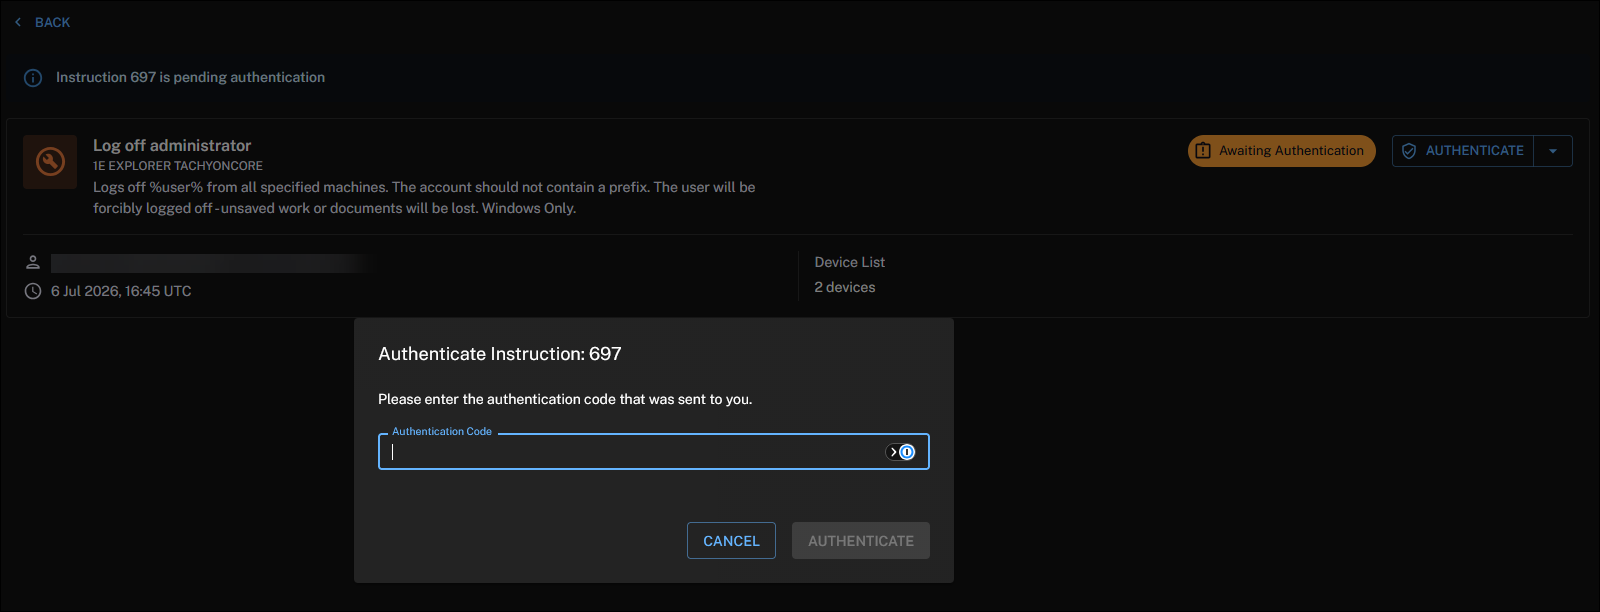
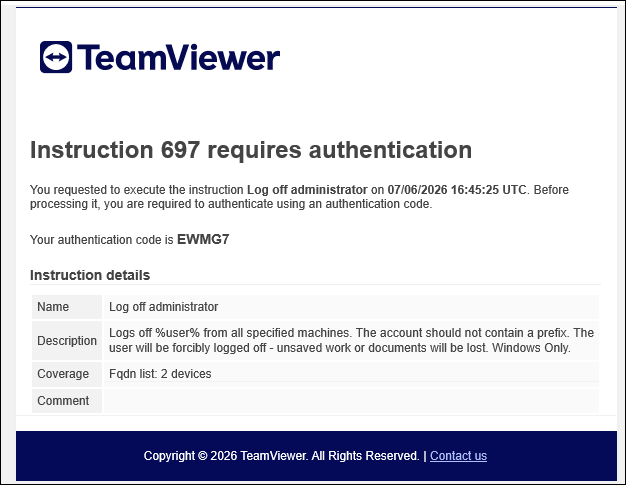
From Investigation > History click the three dots, and then choose Authenticate from the drop-down list. Refer to The action approval workflow.


You can also complete authentication from Endpoint Troubleshooting, refer to The action approval workflow.
-
After the Instruction runs, you will see summary details like Responses, Configuration, and Lifecycle displayed in the Instruction Summary drawer.
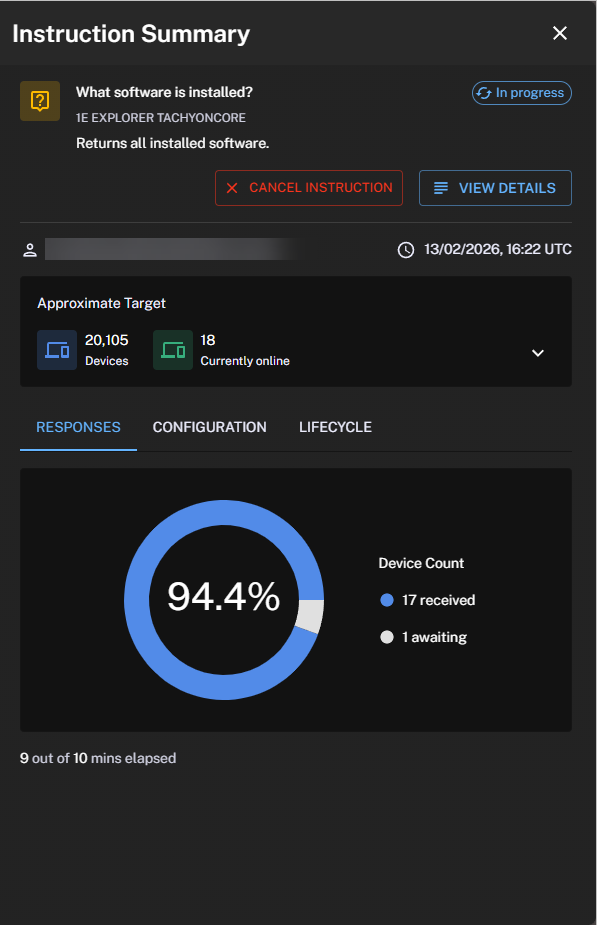
You can also reach Instruction Summary from the Investigation > History, then click Actions > View Details


From the Instruction Summary drawer, you can view instruction responses by clicking View Details.
-
To view progress in Instruction History, click the link in the pop-up Instruction is now running. View it here.
For more information about how to interactively ask questions, run actions, and view responses, and manage operations across all your endpoints in real-time, refer to Endpoint Troubleshooting.