Configuring and managing alarms
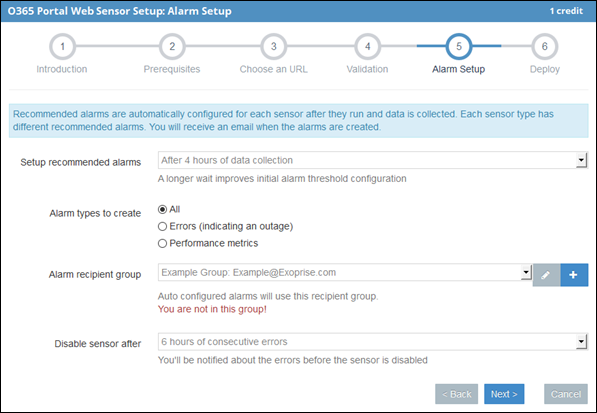
By default, Exoprise automatically configures a set of alarms that engineers consider to be critical for the sensor. When deploying a new sensor, you'll see the following fields in the Alarm Setup section of the wizard.
|
Field |
Description |
|---|---|
|
Setup recommended alarms |
Allows you to specify how long the sensor runs prior to the alarms being configured. Once the sensor has run for the specified times, the alarms will be generated based on the average of that time frame. We recommend configuring alarms during peak hours to prevent them from being too sensitive. If configured during periods of low or no activity on the network or the Microsoft 365 tenant, the baseline thresholds will be much lower. This process can be repeated at any time, and alarms can also be adjusted manually. |
|
Alarm types to create |
Allows you to configure the alarms to trigger on everything, only errors, or only performance issues. |
|
Alarm recipient group |
You can select who will receive the alarms via email or SMS. Additional alerting options are available, including the use of webhooks and email hooks. Refer to Alarm webhooks and Alarm email hooks. |
|
Disable sensor after |
You can specify how long a sensor should run in an errored before it disables itself. If a sensor disables itself, it can be manually re-enabled, or the system will automatically re-enable it after 24 hours. |
You can add additional alarms, aggregate them together, or disable alarms for any sensor or sensor type as described below.
Adding or editing an alarm
-
Navigate to the Add Alarm page.
-
From the Sensor Type drop-down menu, select the type of sensor you want to create an alarm for.
-
In the Element field, click Choose to select an element for the sensor. Each sensor exposes different metrics, sometimes referred to as elements. Refer to Operational elements.
When you choose a sensor type and an element, the table of matching, deployed sensors at the bottom of the page is updated with recent values for each location where a sensor has been deployed. Eight hours worth of aggregate history (Min, Max, Avg) is displayed.
-
Using the values from the table, choose an appropriate comparison threshold value for your alarm in the Threshold field. A good starting point is typically +/- 10% of the maximum value, assuming the monitored service has been operating well and depending on the desired alarm sensitivity.
Ideal threshold values may be different for each of the different sites (locations) where you have deployed sensors. The best practice when configuring an element is to look at the sensors table at minimum, maximum, and average values for each element. When you choose a different element, the table is updated for each site. If the monitored service is operating correctly, it's recommended to choose a value that is slightly greater (around 10% or similar) than the maximum.
-
In the Alarm Recipient Group field, update the recipients for the alarm. Different groups can be configured.
-
Optionally, in the Email Hook and Web Integration fields, create or choose email hooks or webhooks for the alarm.
-
Check each of the sensors you would like to apply the alarm to in the table at the bottom of the page.
-
Click Create Alarm to finish adding the alarm, or click Update Alarm if you are editing an alarm.
Operational elements
Most sensors have two operational elements that can be monitored:
-
operations.SensorError: This is for tracking sensor errors throughout the system and sensor.
-
operations.SensorOffSchedule: If the sensor stops running or is unable to communicate with Exoprise servers, this alarm will fire and notify the recipients.
Email subject template
The subject of alert emails can be formatted by including options from the following list surrounded by $:
-
sensor_type
-
element
-
visible_element
-
element_type
-
operator
-
operator_value
-
consecutive_periods
-
period
-
affected_percent
-
affected_threshold
-
location
-
name
-
title
-
ipaddress
-
sensor_interval
For example, an email subject might be configured like this: A $sensor_type$ sensor alarm has fired after $consecutive_periods$ periods.
You can also include links to either the sensor or the alarm in the alarm email subject.
-
alarm_link
-
sensor_link
For example, an email subject might be configured like this: A $sensor_type$ has fired: $alarm_link$.
Aggregate alarms
Aggregate alarms are a powerful mechanism to get notified when cloud or application issues are affecting multiple locations, or to reduce alarm noise for what might be transient network or application conditions.
Aggregate alarms generate alerts or notifications only when the condition or threshold is affecting multiple CloudReady synthetic sensors.
Example
For example, if you deploy 10 email sensors across 10 different branch offices, you can configure a single alarm to monitor a condition across all 10 sensors and set the aggregate percentage to 30%. The alarm will only be generated when four or more sensors exceed the threshold or report an error.
This can be very helpful for identifying when there is a centralized cloud service error condition or a performance slowdown.
Configuring aggregate alarms
Aggregate alarms are not automatically configured when sensors are deployed. We recommend first removing any existing alarms for the condition that you will configure, and then setting up the aggregate alarm.
-
Navigate to Alarms > Alarm Dashboard in the left navigation menu.
-
Aggregate alarms can only be configured for the same sensor type, so choose the sensor type and click Filter in the upper right of the page.
-
Remove the existing alarms for the condition that you would like to configure across the sensors. Select the relevant alarms, then click Delete in the Actions drop-down list, and then click Apply.
-
Click Add Alarm in the left navigation menu.
-
Select the sensor type from the drop-down list.
-
Choose the element or condition you want to alarm on. Configure the threshold and consecutive periods as you would for a normal alarm.
-
Choose the percentage of sensors that you want to "vote" on the alarm condition. For example, if you have 10 sensors and only want to be notified when half of them breach their threshold or experiencing the condition, set the Aggregate Alarm percentage to 50%.
-
Configure the recipient group, name, and notes for the alarm.
-
Finally, in the table at the bottom of the page, choose all of the sensors that the alarm will apply to, and click Create Alarm.
This creates an aggregate alarm for an error condition or performance threshold applied to all of the sensors of a certain type. The alarm will only be triggered when the condition is breached across half or more of the sensors.
Disabling alarms
-
Navigate to Alarms > Alarm Dashboard in the left navigation menu.
-
Use the filters in the top right to select the type of sensor for which you want to disable one or more alarms.
-
Select the relevant alarms.
-
Click Disable in the Actions drop-down list and click Apply. If you want to disable only one alarm, you can also clear the Enabled checkbox for that alarm on the far right.