Experience Analytics
Experience Analytics helps you visualize your end-users' experience of IT service delivery across your enterprise.
Introducing 1E Experience Analytics
1E Experience Analytics helps you visualize your end-users' experience of IT service delivery across your enterprise. It is centered around the experience score, which is based on metrics that cover four categories:
-
Stability - derived from the frequency of operating system and software crashes, hangs and service failures.
-
Responsiveness - based on the speed of operating system startup, system resource creation and availability.
-
Performance - a weighted indication of load and throughput for device processor, memory and disk resources.
-
Sentiment - an aggregated measurement of users feelings or opinions of their device's performance, stability and responsiveness based on user surveys.
For a glossary of Experience terms, refer to Experience glossary.
1E Experience Analytics Features
For details on how scores are collected and calculated, refer to Score reference.
-
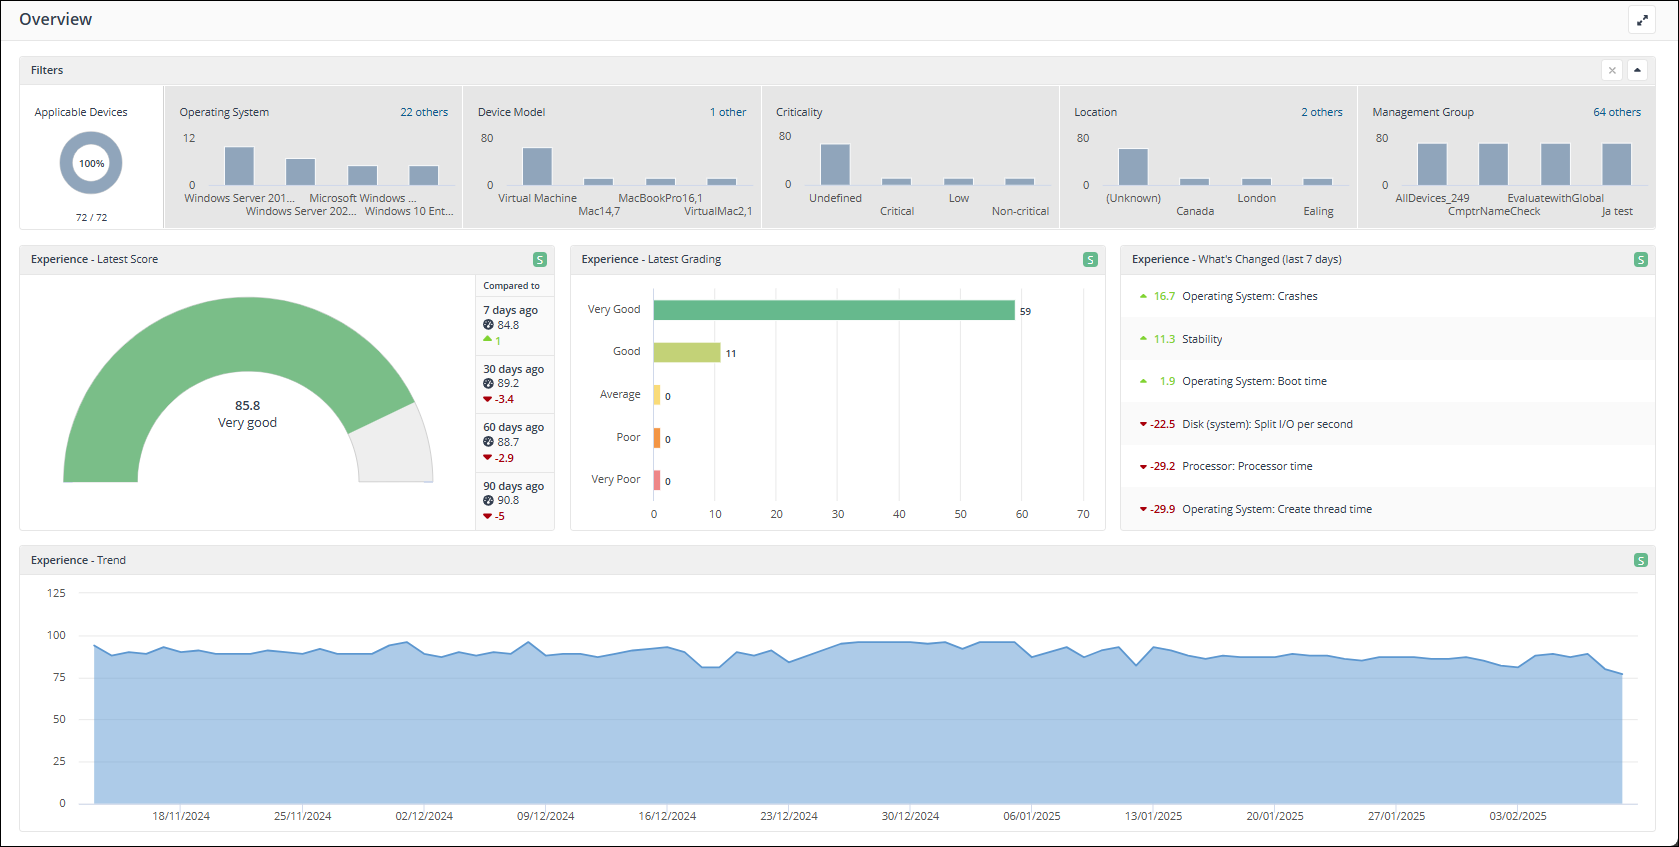
Overview page: A dashboard of the Experience Analytics score.
-
Categories page: A dashboard of the Stability, Responsiveness, Performance and Sentiment scores.
-
Stability page: A dashboard of the Stability score.
-
Responsiveness page: A dashboard of the Responsiveness score.
-
Performance page: A dashboard of the Performance score.
-
Sentiment page: A dashboard of the Sentiment score.
-
Devices page: lists all the devices that are reporting into Experience Analytics.
-
Software page: Shows all the software titles that are installed in the entire environment.
-
Users page: Shows metric data for the users in the entire environment.
-
Surveys page: Shows all the surveys created in the entire environment, and allows for surveys to be created, cloned, deleted, enabled, disabled, and assigned to management groups.
-
Filters page: The Filters bar is at the top of each page and is used to change the view of the tiles on that page.
-
Tile buttons: There are a set of Tile Buttons on the Stability, Responsiveness, and Performance pages, they can be used to show different views on the tiles or open other windows for details.