1E for Business Impact
About Business Impact
Business Impact allows you to open incident tickets in an ITSM solution or offload data to other solutions like Splunk. This article explores the core functionality in Business Impact.
Supported third-party tools include the following:
- ServiceNow (Versions: Washington DC, Xanadu, and Yokohama)
- Jira Service Management
You can access Business Impact under the Solutions tab when you log in to the 1E Platform. Platform Modules and Solutions visibility depends on your license agreement.
Prerequisites
-
Download the 1E Solutions Core DEX Pack and any Solution-specific packs from 1E Exchange, and then upload them to your 1E Platform instance.
-
Complete the implementation steps before using 1E Solutions. Refer to Solutions getting started.
Features
This dashboard provides an overview of your most effective automation policies. Data is cumulative and is shown by day, automations run, devices impacted, tickets avoided, time savings, and cost savings. You can use the filters at the top of the page to change the date range or focus on specific policies.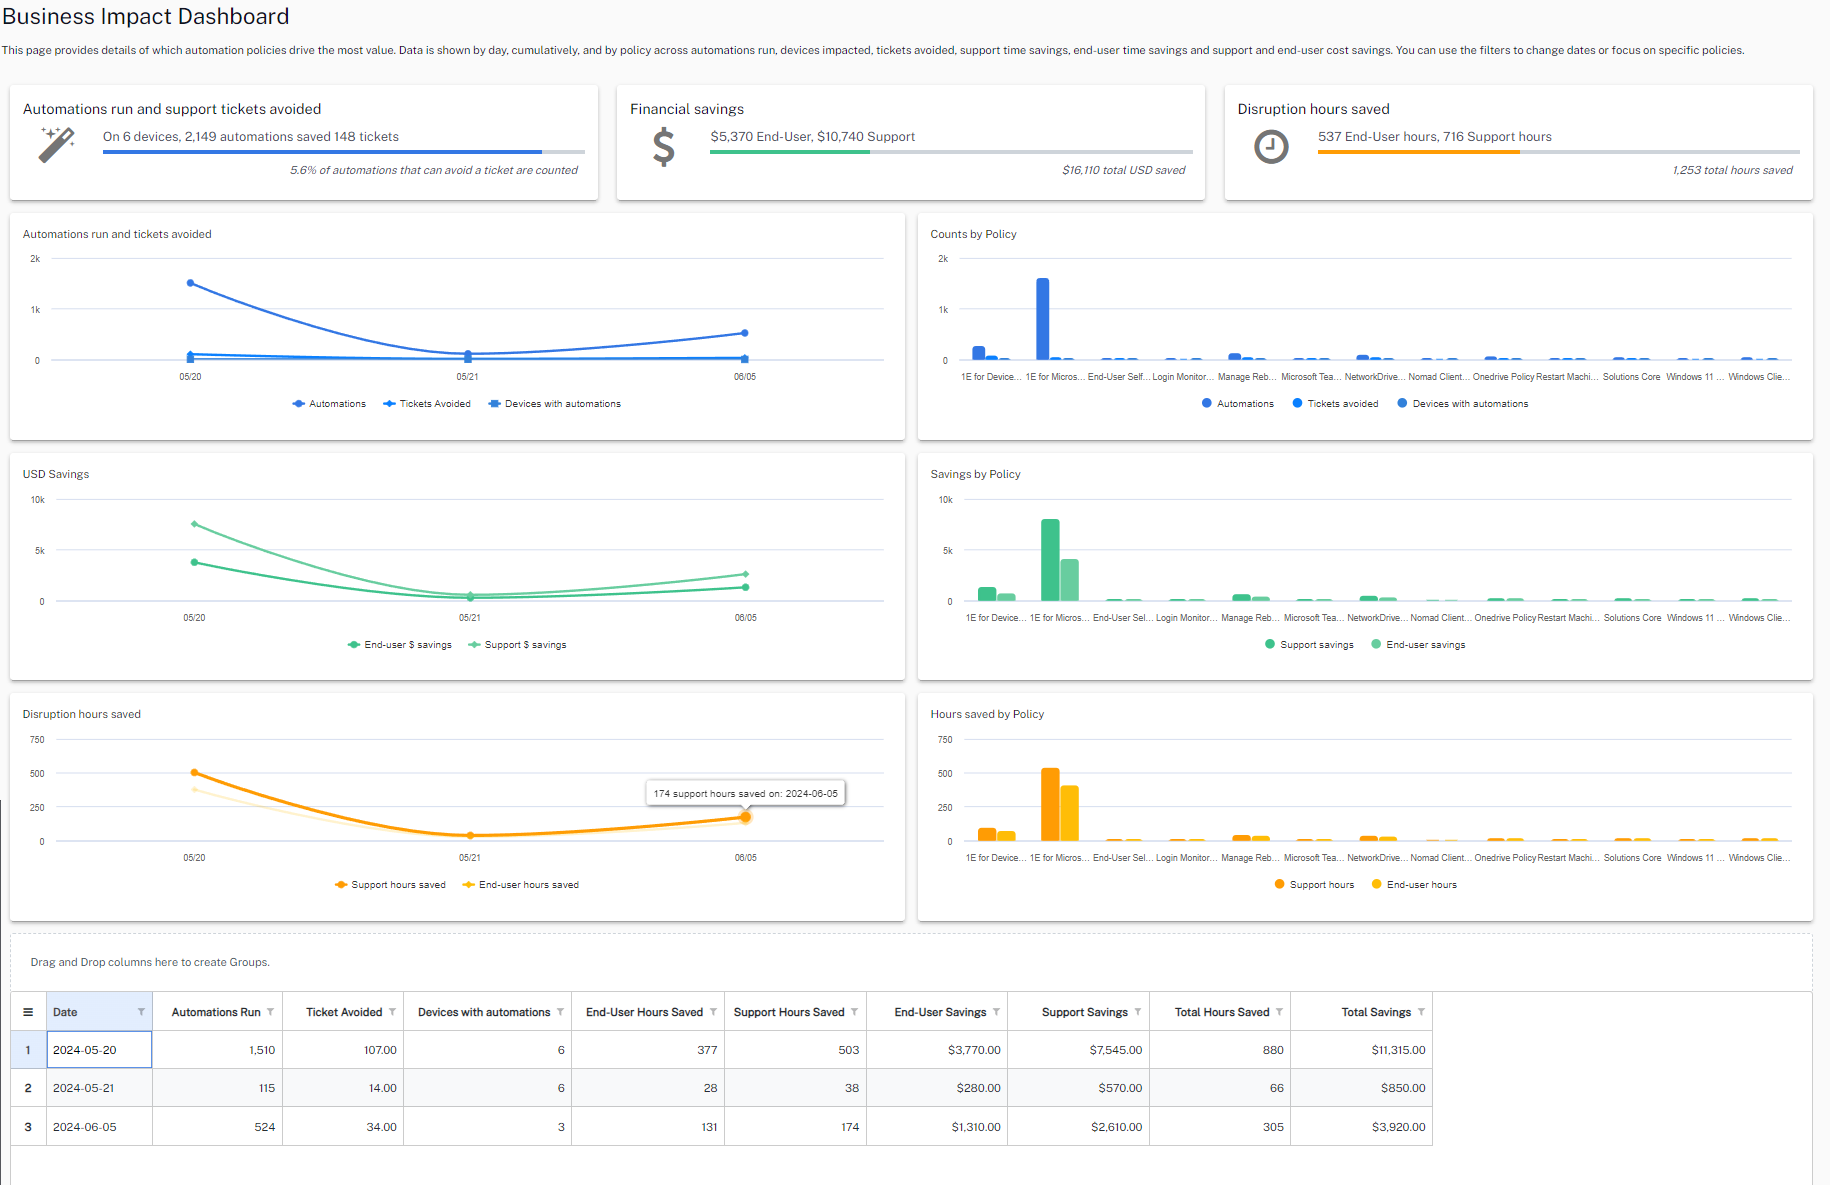
The three panels at the top of the page provide an overview of the following:
- Automations run and support tickets avoided: Where devices have undergone automation to resolve issues identified by Endpoint Automation rules.
- Financial savings: Represents the savings achieved by avoiding support tickets for both end users and support agents.
- Disruption hours saved: Represents the time saved for both end users and support agents by avoiding disruptions due to issues.
Tickets avoided charts
The number of tickets avoided due to automation rules, based on the number of incidents that did not occur or were automatically resolved .
-
Automations run and tickets avoided
Displays the number of automations run on devices and the number of tickets saved on a day-to-day basis.

-
Counts by Policy
Displays the number of automations run on devices and tickets saved.

Dollar savings charts
Dollar savings from the automation rules, based on the cost of the manual effort saved due to automation including the cost savings per ticket avoided.
-
Savings (in USD)
Displays the amount saved in USD for both end users and support agents on a day-to-day basis.

-
Savings by Policy
Time savings charts
The time saved due to automation, based on the average time taken for the manual completion of tasks that are now automated.
-
Disruption hours saved
Displays the time saved for both end users and support agents by avoiding disruptions from issues.

-
Hours saved by Policy
Displays the total hours saved for both end users and support agents.

Refining chart data
You can refine the data shown by clicking on the elements at the bottom of each chart.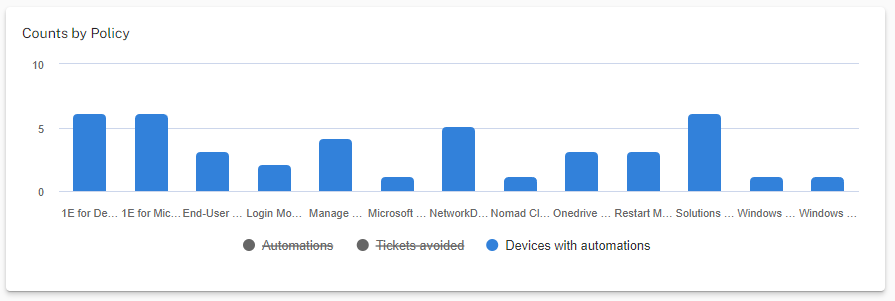
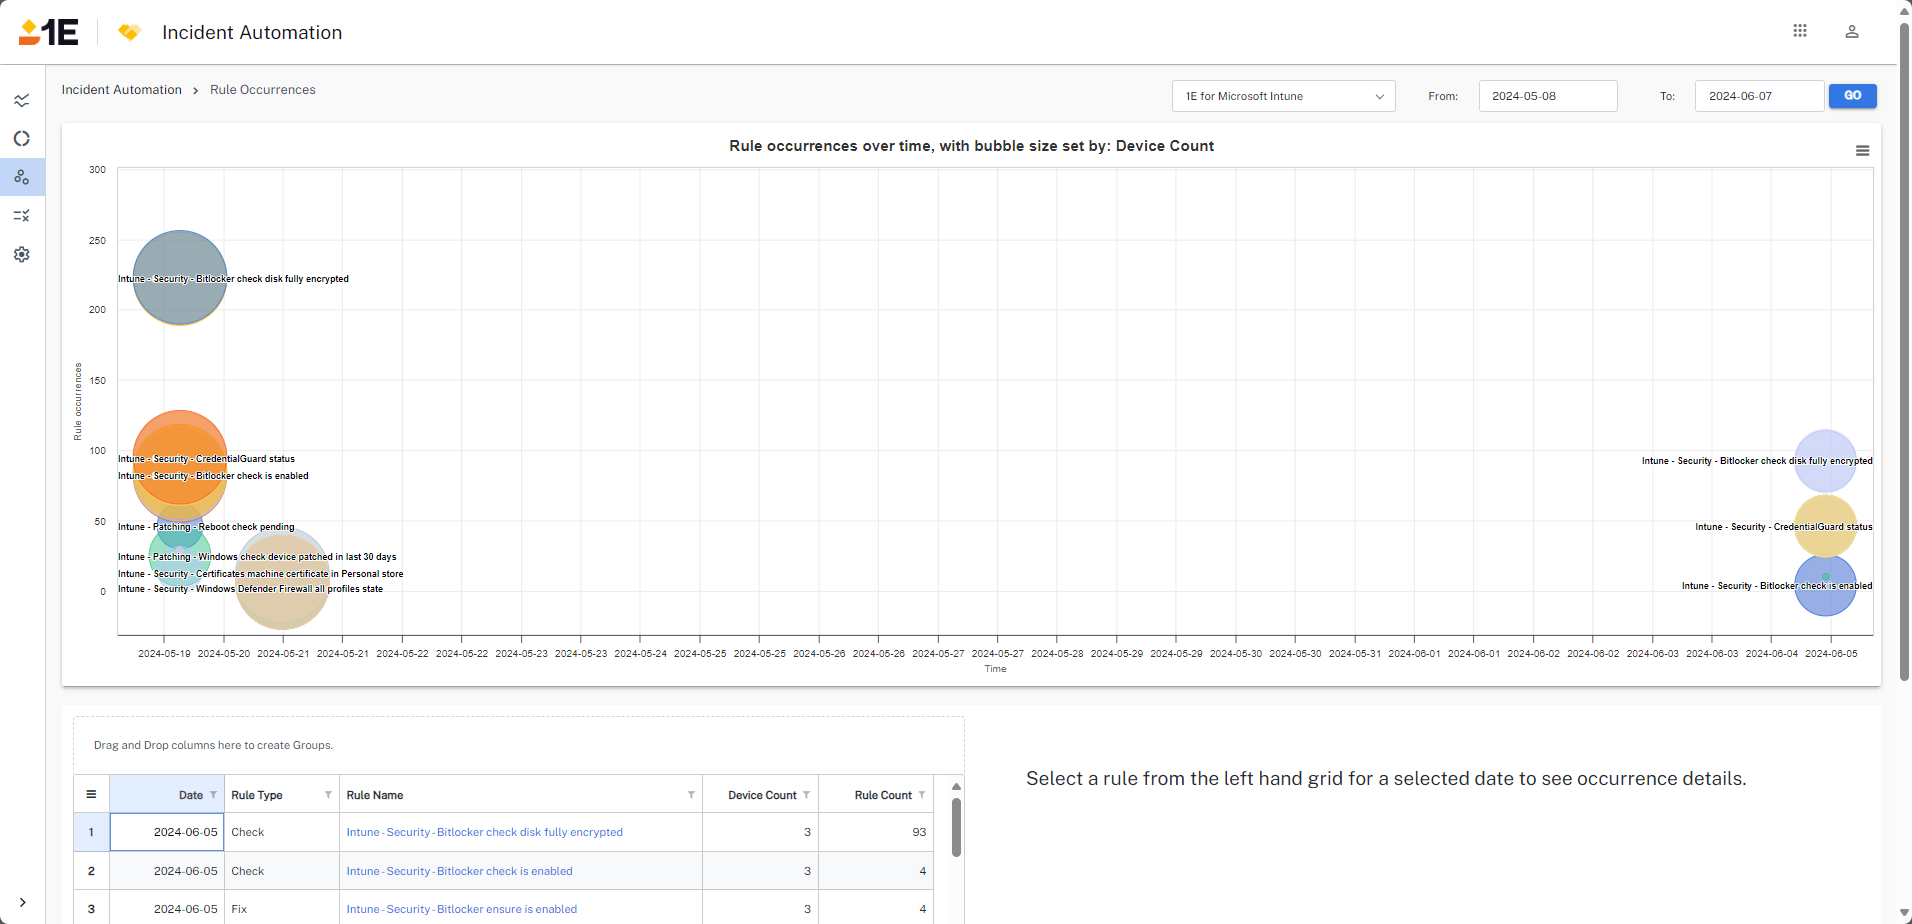
Clicking the elements in each chart loads that data set on the Rule Occurrences page in a bubble size set. For example, clicking the column for automations run by 1E for Microsoft Intune takes you to the Rule Occurrences page with that data loaded.
RoI device grid
The device grid shows data based on the automations run on a day within the specified time period.
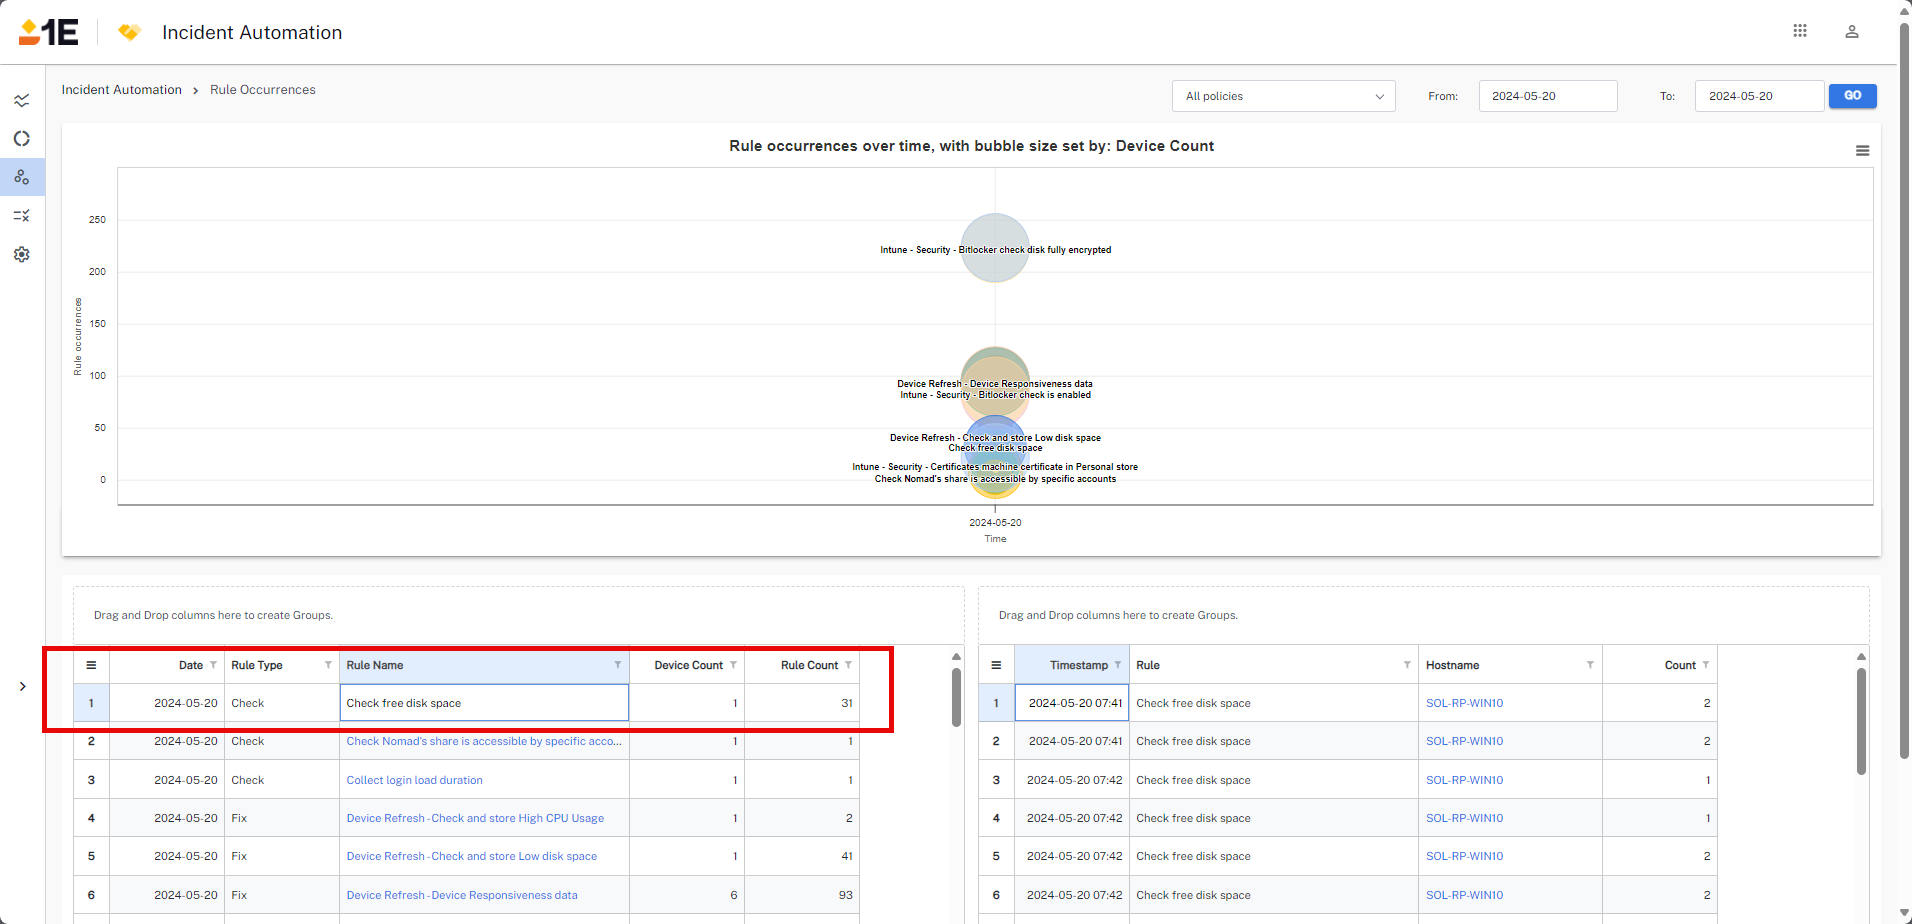
Clicking a value in the device grid opens the Rules Occurrences page focused on that date. You can then select a rule from the left-hand grid to view details. For example, clicking 2024-05-20 from the grid opens that day's rule occurrences.
From here, you can click a device and explore its specific Event Types. In this example, we can see that this device experiences low disk space and excessive CPU load over a period of several days.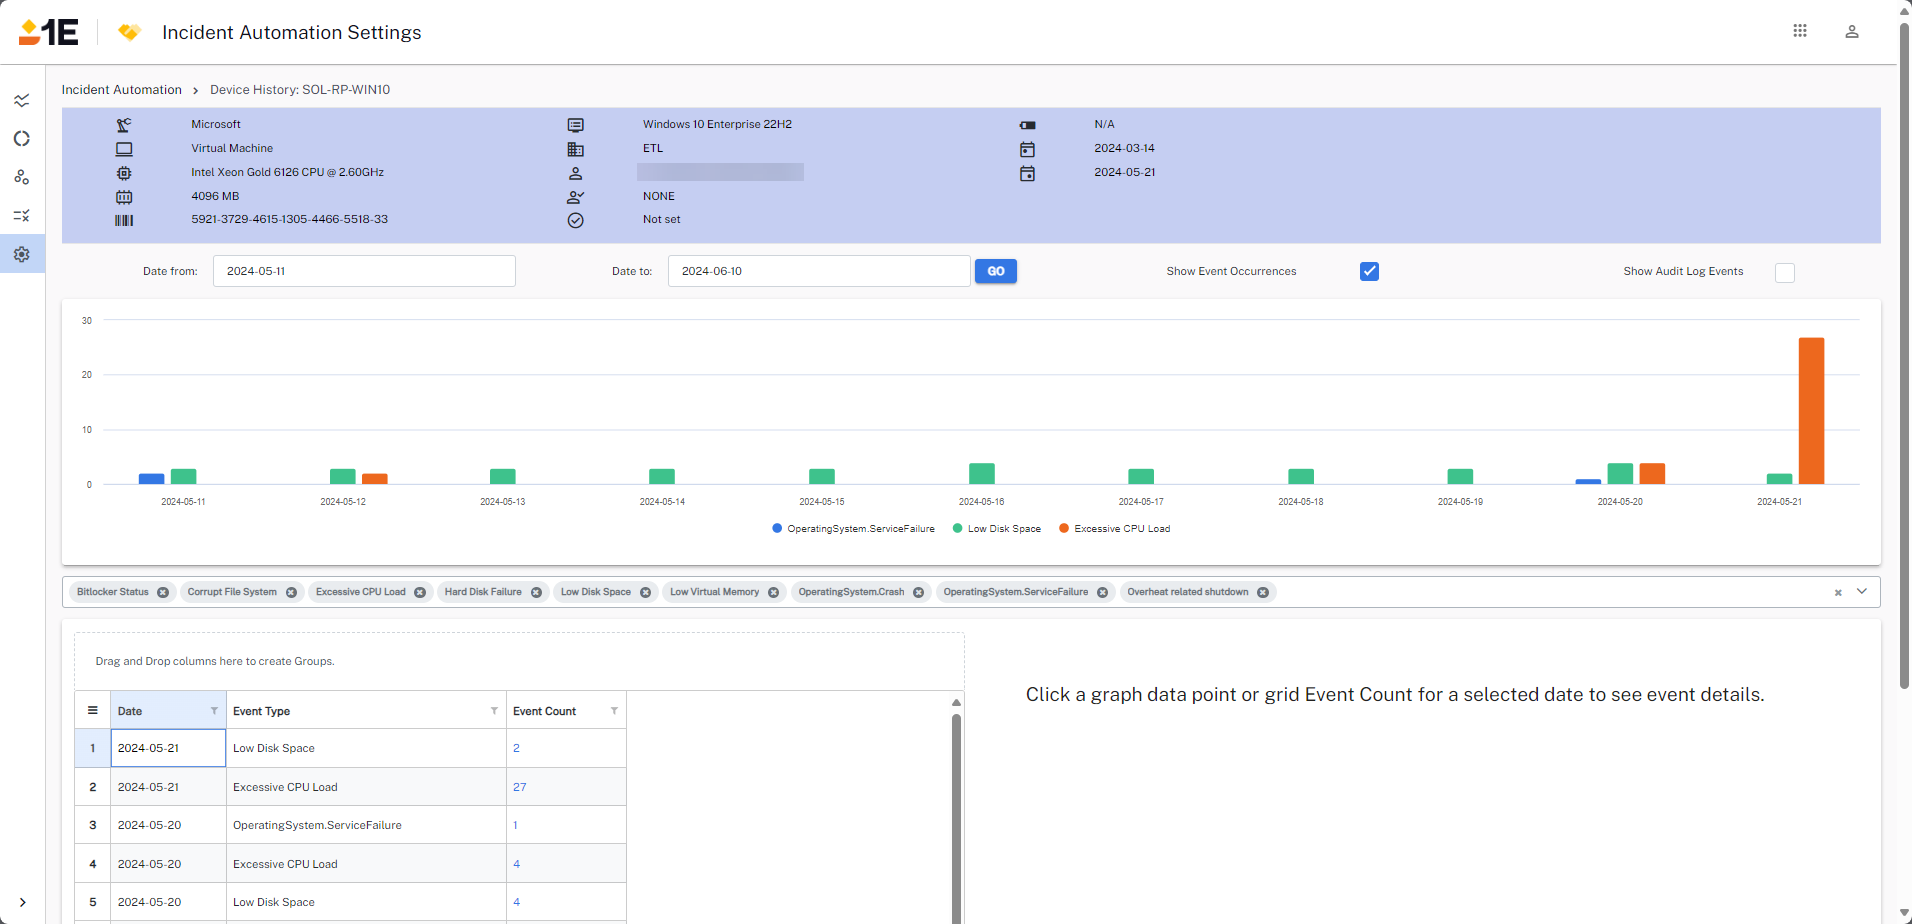
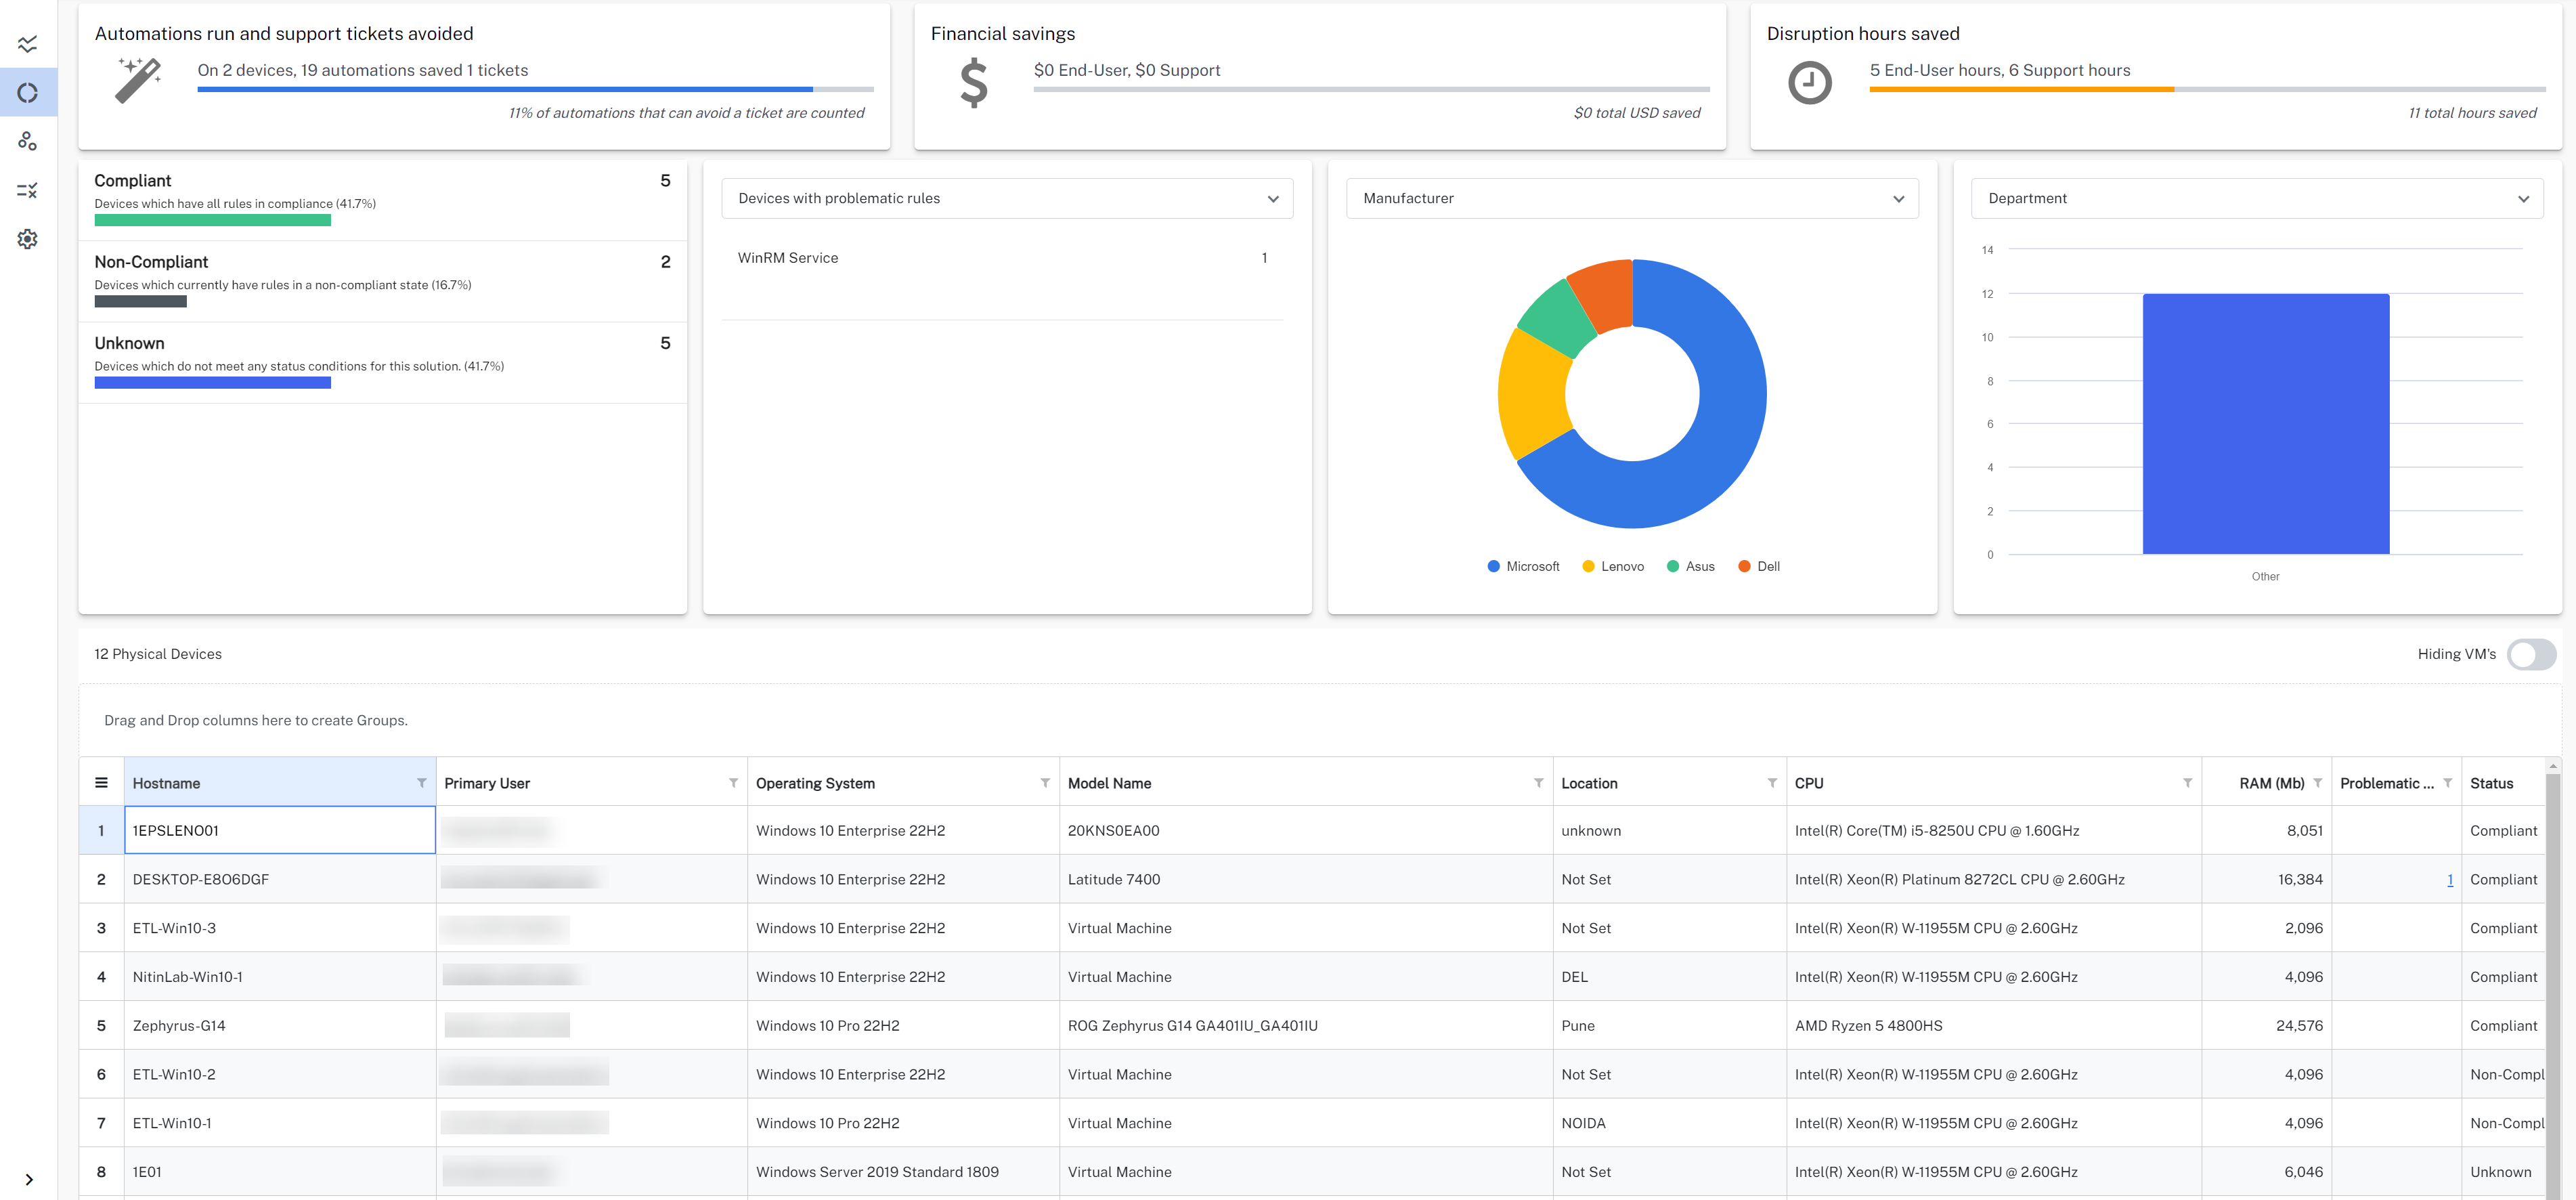
The Operational Dashboard provides you with actionable data.
For details about the three panels at the top of the page, refer to RoI Dashboard.
Status
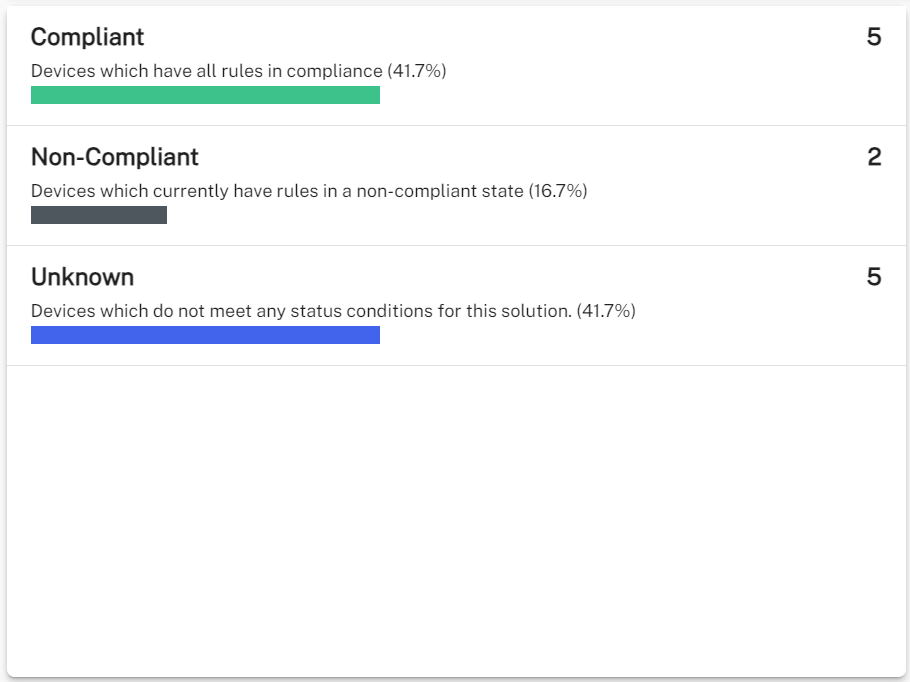
Clicking a filter adjusts the overall dashboard to display the count of devices based on that status.
- Unknown: No rule information is available for a device to evaluate its status. By default, all devices imported for the first time will appear as unknown. Once you have imported rule data, the status will change.
- Problematic: A device will report as problematic when one or more automation rules are triggered repeatedly and exceed the problematic count threshold.
- Compliant: A device that has all rules in compliance is categorized as Compliant.
- Non-compliant: A device that does not have every rule in compliance is categorized as Non-compliant.
- Error: Non-compliant devices that have failed to be fixed.
Devices with problematic rules
Displays the device count for problematic rules and allows you to filter the dashboard based on the problematic count. The Devices with problematic rules filter is displayed by default.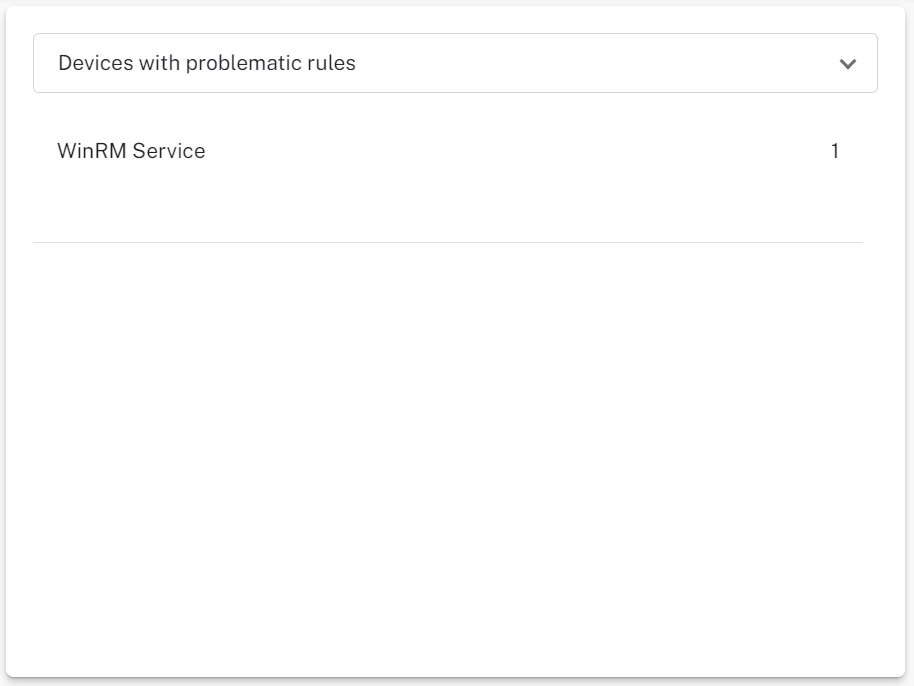
The other filters available using the drop-down menu are the following:
-
Model Category: Displays the model category of devices in a graph and allows you to filter the dashboard based on the model.
-
Location: Displays the count of devices in a graph and allows you to filter the dashboard based on device location.
Manufacturer
Displays the count of devices in a pie chart and allows you to filter the results based on device manufacturer.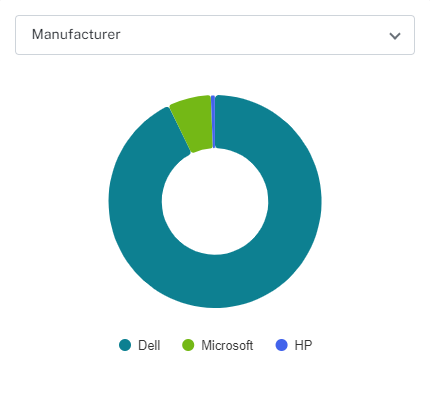
You can refine the Dashboard by selecting a manufacturer and choosing from the following:
-
CPU Type: Displays the count of devices in a pie chart and allows you to filter based on CPU type.
-
Operating System: Displays the count of devices in a pie chart and allows you to filter based on OS version.
-
RAM GB: Displays the count of devices in a pie chart and allows you to filter based on device RAM size.
-
Top 10 Models: Displays the total number of devices in each of the top ten model categories in a pie chart and allows you to filter based on model.
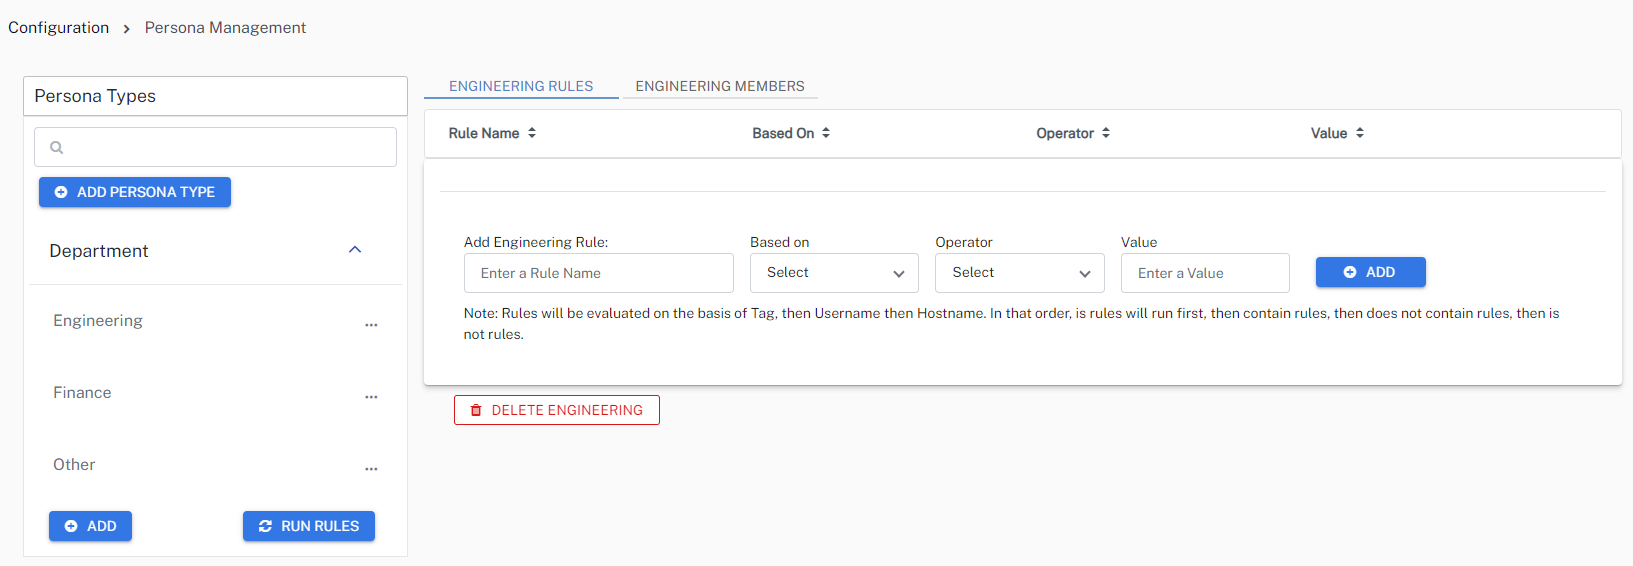
Persona Types
This example filter is based on a persona type called Department and displays the count of devices associated with this type.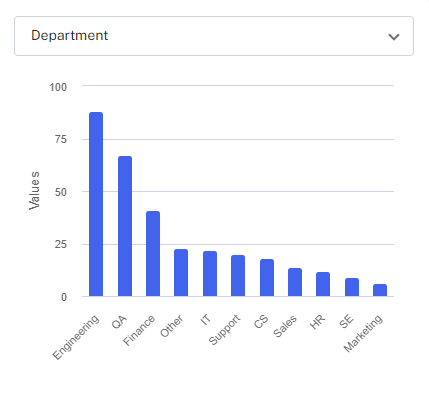
This tile allows you to filter based on the Persona Types you have created. The drop-down menu is automatically updated when you create a new type.
Operational Dashboard device grid
The grid lists device information along with its status. Clicking on a device name opens its Device History, where you can click a graph data point or grid Event Count for a selected date to see more details.
For information about the device grid accompanying the RoI Dashboard, refer to RoI device grid.
The Rule Occurrences page displays event details over a specified time using a bubble chart with a bubble size set. You can customize the chart by clicking on a bubble to focus on a specific occurrence or by selecting a rule from the grid underneath.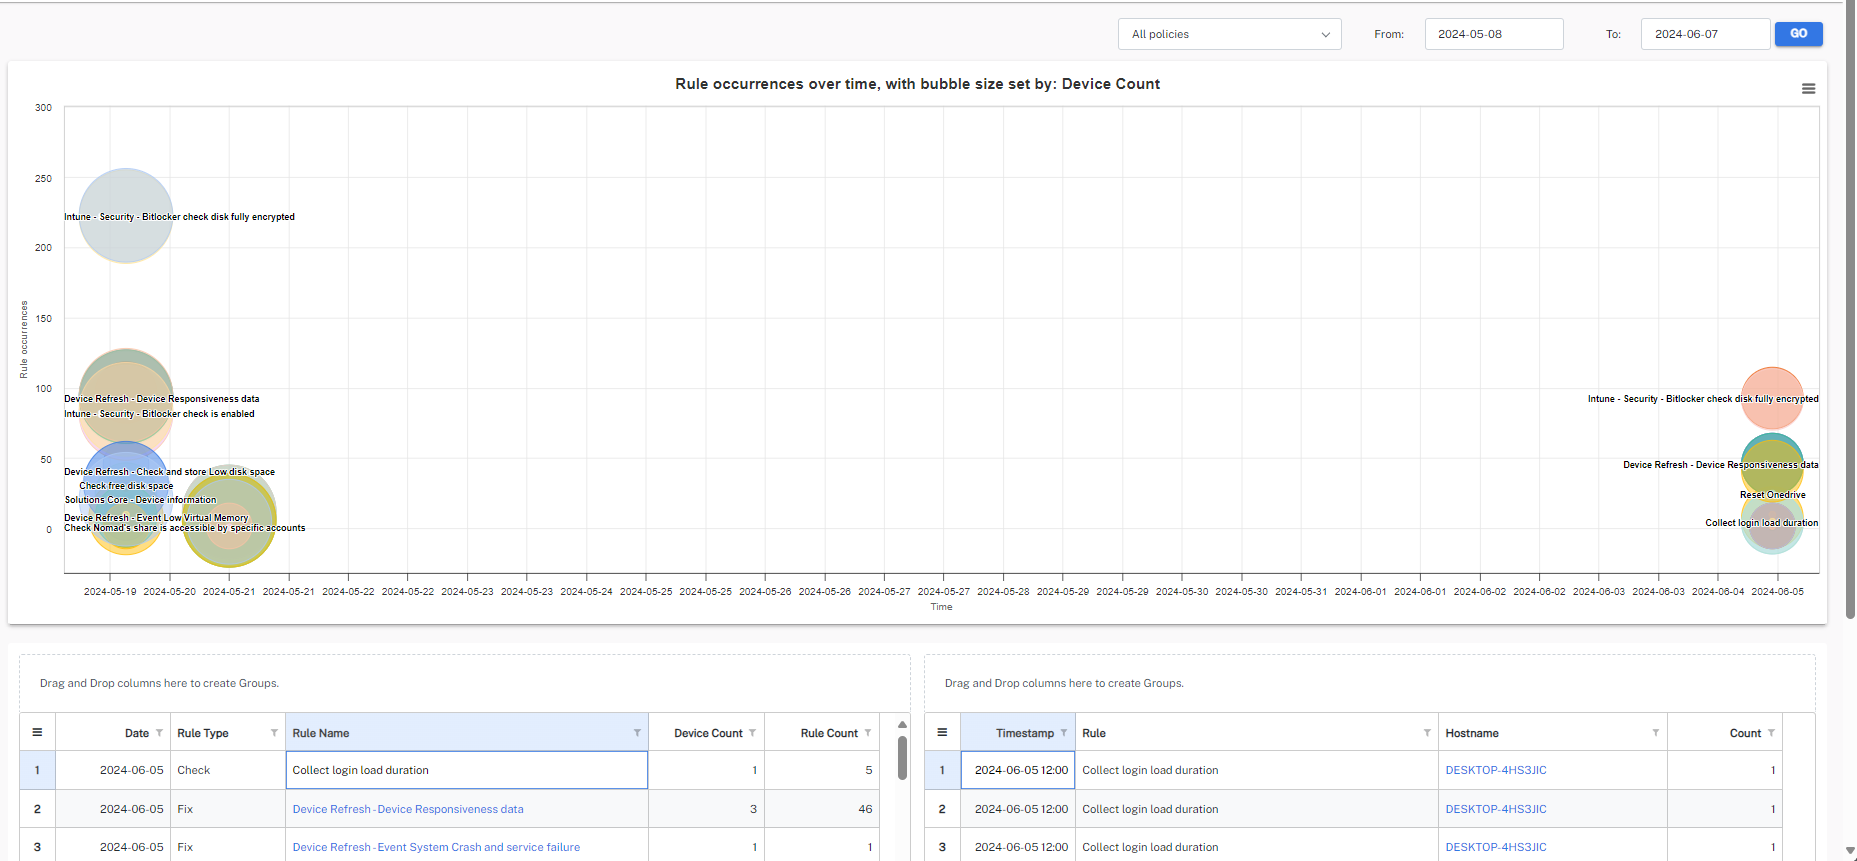
Clicking the three bars at the top right of the bubble chart allows you to view the chart in full screen, an option to print, and multiple download choices.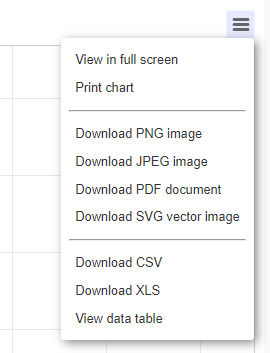
The Policies and Rules page offers a view of policies and rules enabled in the 1E Platform.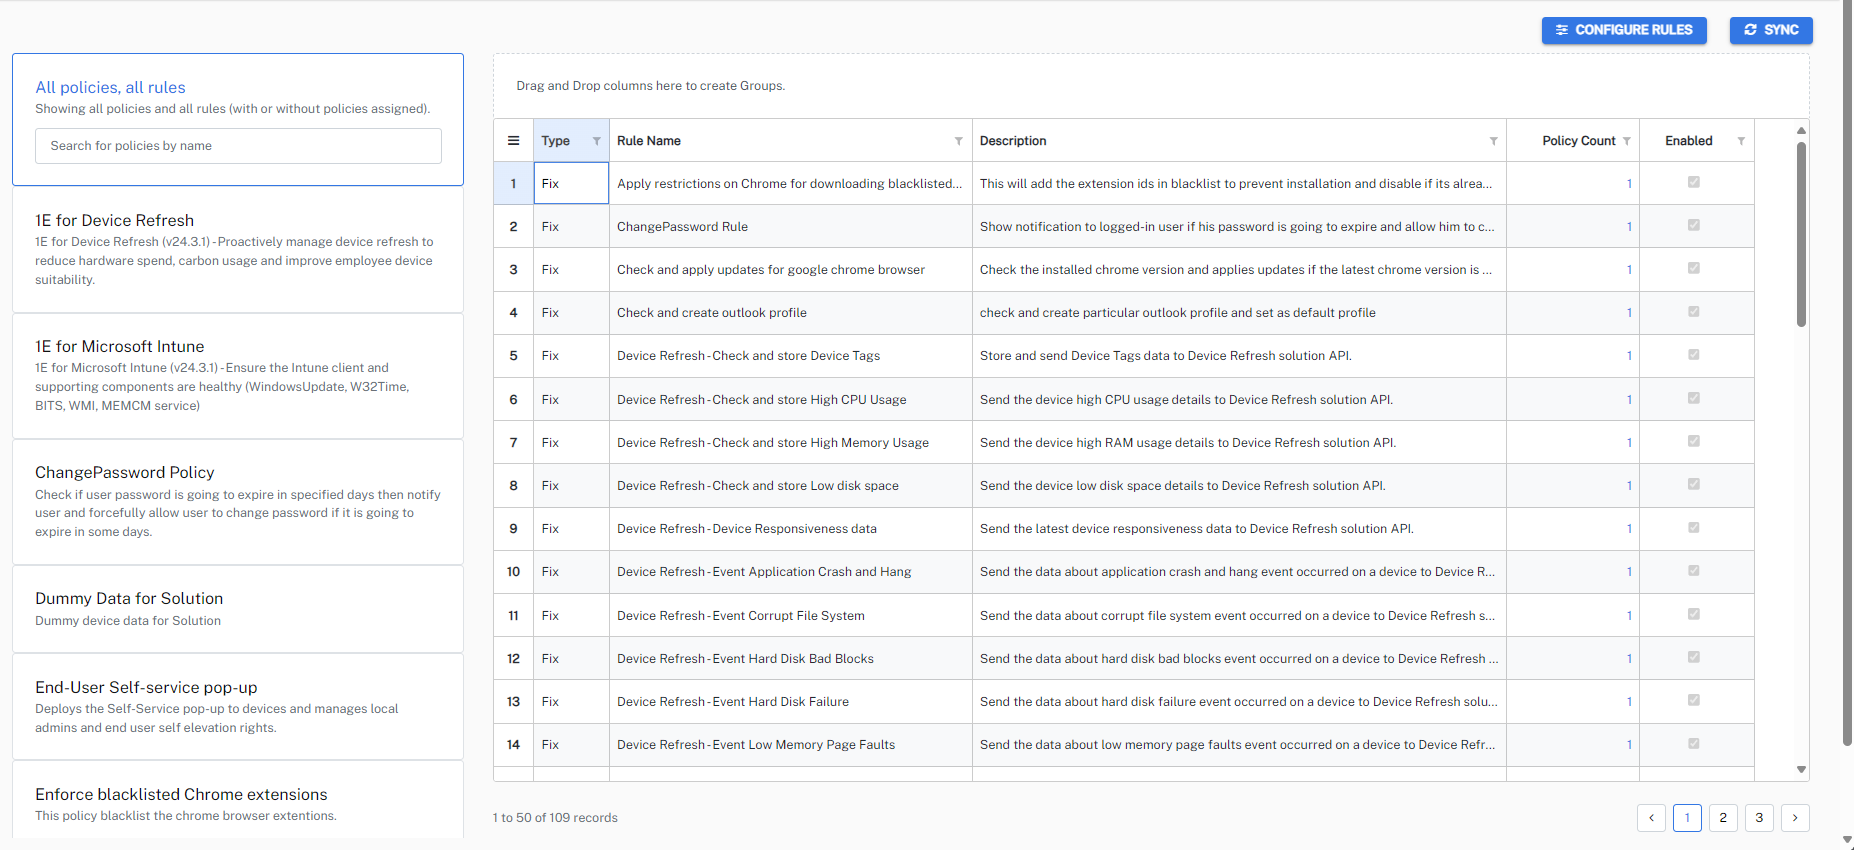
Business Impact offers integration with ServiceNow and Jira so you can configure rules allowing Solutions to open incidents if a rule fails.
Synchronizing rules
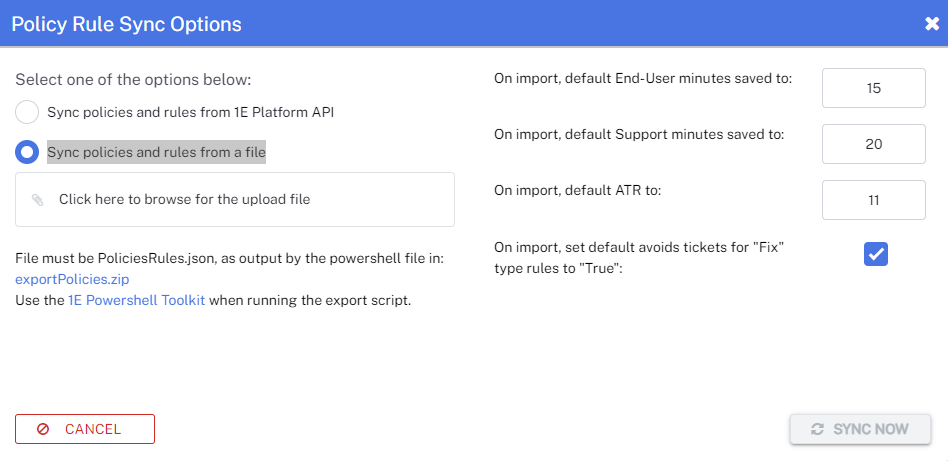
You should sync your Business Impact rules using an account with a valid JWT mapping with the 1E Platform, or use a JSON file extracted by running a PowerShell script.
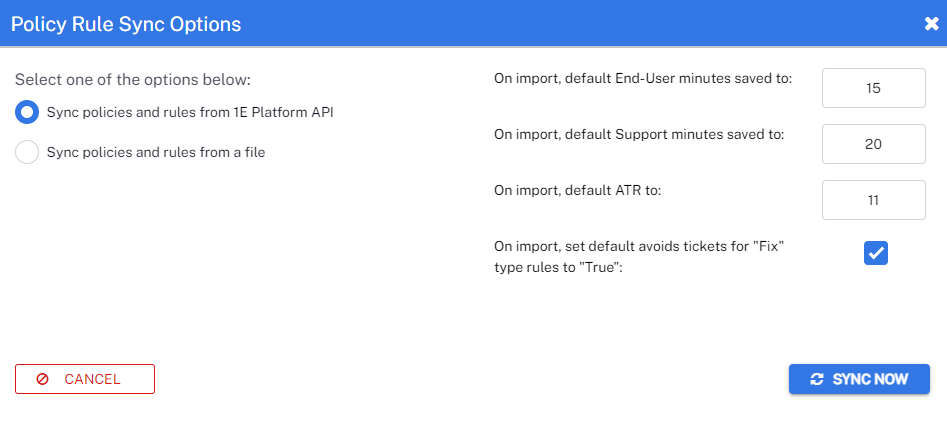
Click sync from the top left-hand corner of the screen and then your preferred method.
- Select Sync policies and rules from the 1E Platform API.
- Select Sync policies and rules from a file.
Once your rules have been successfully fetched or uploaded, enabled rules are marked with a checkbox.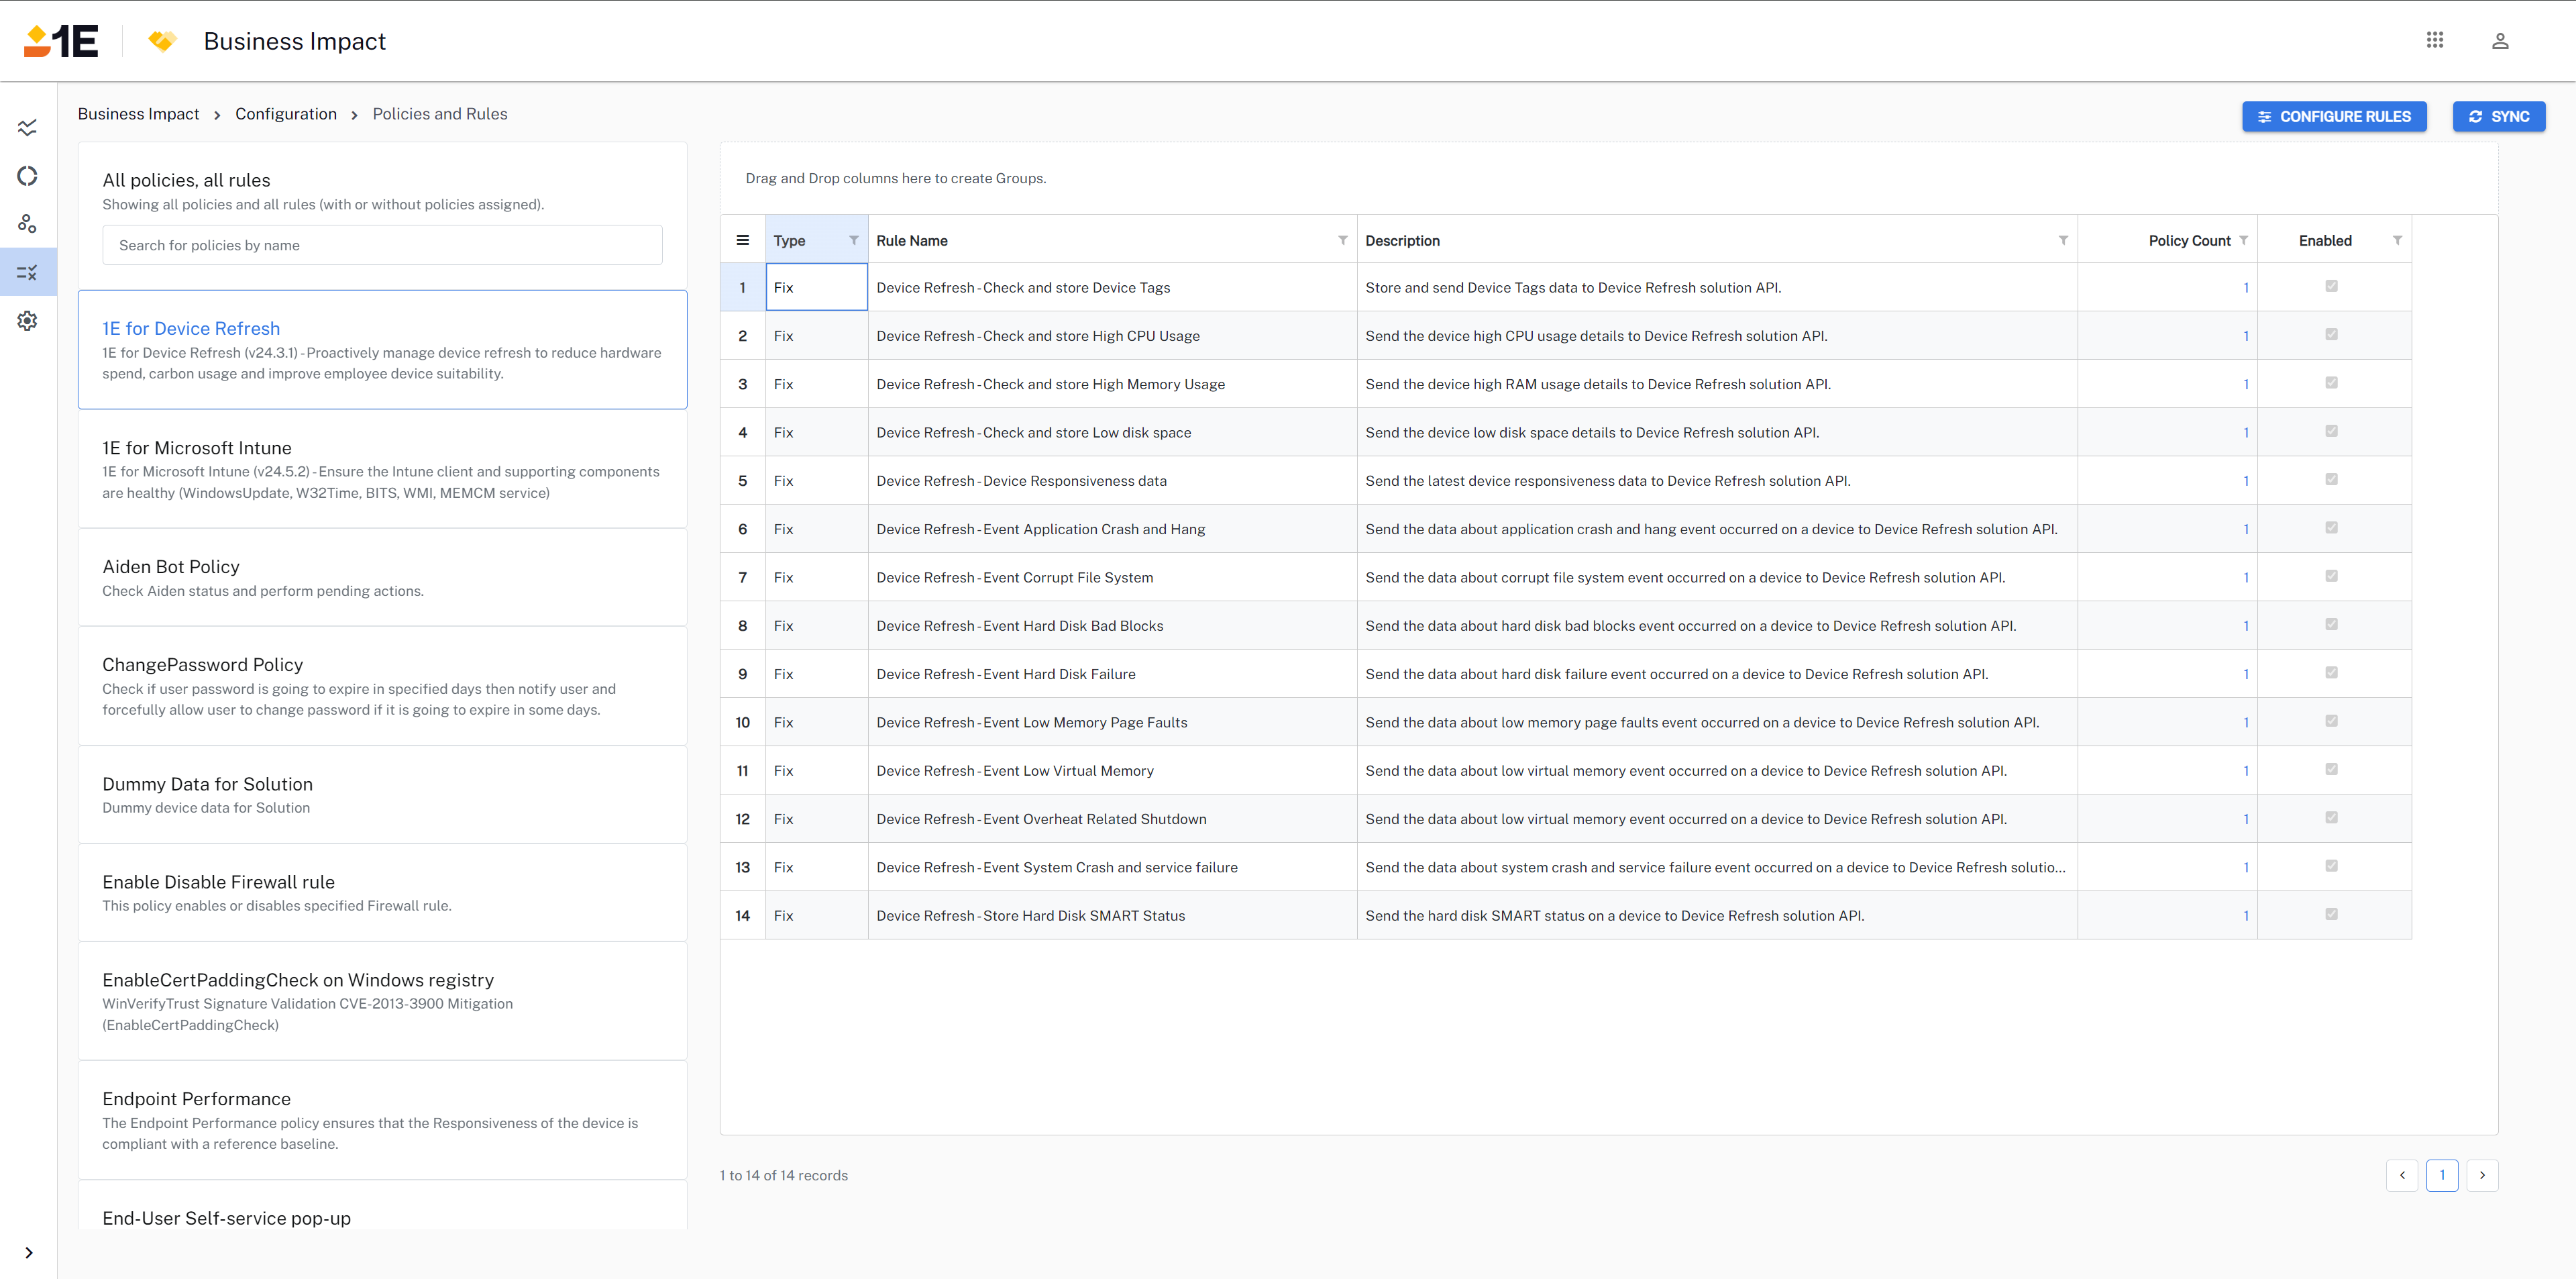
Configuring rules
You have the following options for each rule:
- Creates Ticket: When this rule executes, log a ticket.
- SLA Days: The number of days before the SLA for this issue has been passed.
- Avoids Ticket: When this rule executes, consider it as avoiding a ticket if the count is over the ATR (Automation Ticket Ratio).
- ATR: Automation Ticket Ratio. The number of automations that need to execute before a ticket is considered as being saved.
- End-User Mins Saved: The amount of end-user minutes saved by this automation.
- Support Mins Saved: The amount of support minutes saved by this automation.
- Problematic Count: If the rule triggers more than this number of times in X hours, it's considered to be problematic.
- In (hours): If the rule triggers more than the Problematic Count in this number of hours, it's considered to be problematic.
Rule type Fix
Select the Creates ticket checkbox to create a ServiceNow or Jira Ticket once the rule is triggered.
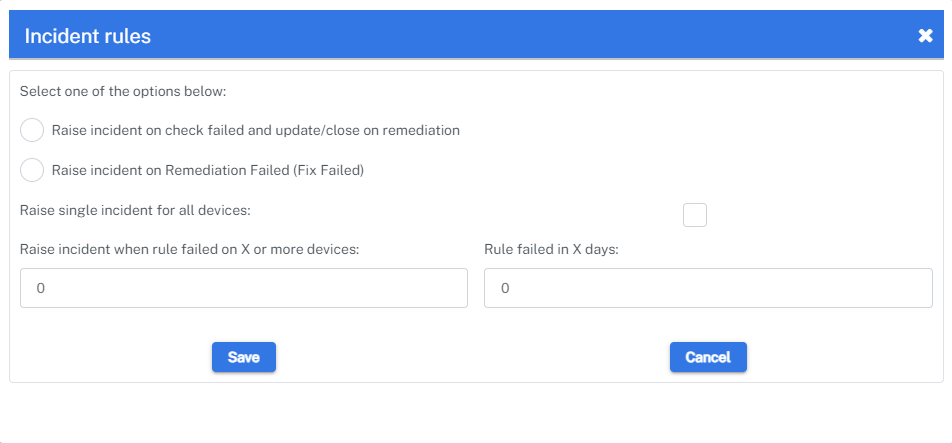
On the Incident Rules modal, there are two options:
- Raise incident on check failed and update/close on remediation: The incident will be raised and closed when the fix is applied on the device. If the check or fix fails to apply, the incident will be in an open state.
- Raise incident on Remediation Failed (Fix Failed): The incident will only be raised when a rule has failed to apply the fix on the device. If the check and fix both pass, the incident will not be created.
If Raise incident when rule failed on X or more devices is set to Raise incident on Remediation Failed (Fix Failed), a common incident will only be created when the rule fails on X or more number of devices in X days. For example Rule Intune - Windows Remote Management Service is configured to raise an incident when the rule fails on 10 or more devices in two days.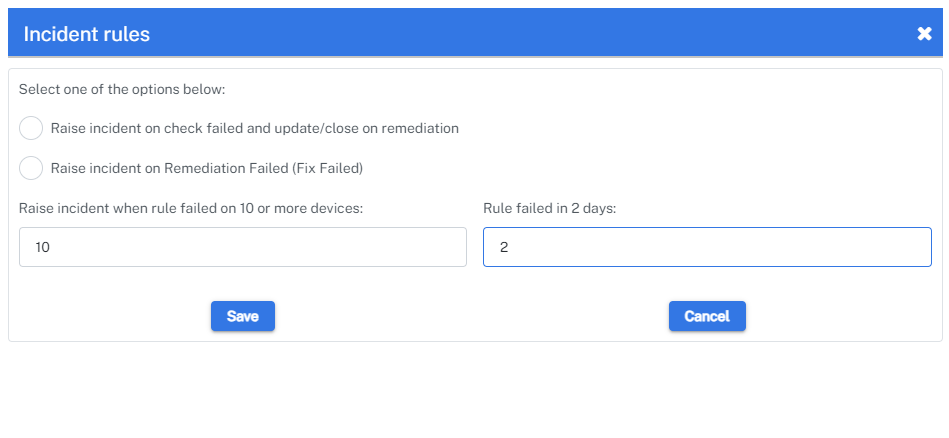
Raise single incident for all devices: A common incident is raised with the device name included in the work notes.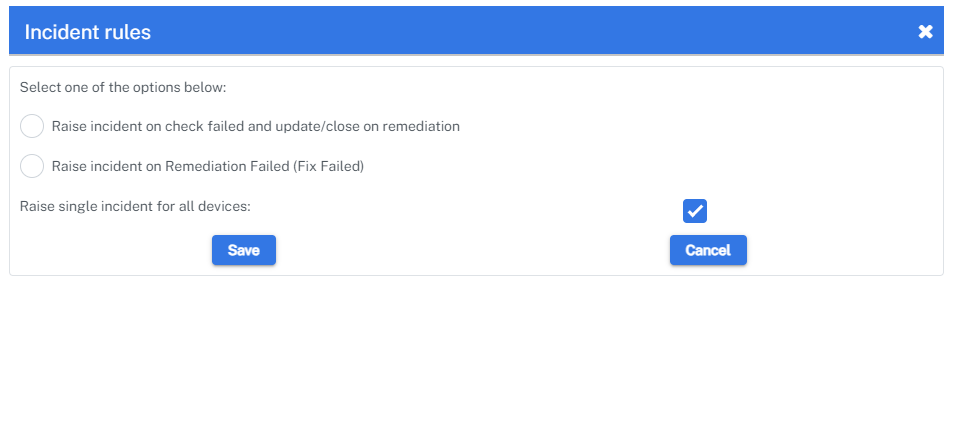
This option is only visible when Raise incident when rule failed on X or more devices and Rule failed in X days are not configured, and the values are 0.
Rule type Check
By default, when a check fails, a separate incident is created. You can customize the type of incident that is created using the following options:
- Raise single incident for all devices: A common incident is raised with the device name included in the work notes.
- Raise incident when rule failed on X or more devices and Rule failed in X days: A command incident is raised for all devices when the threshold is met.

Check the Avoids ticket checkbox to avoid incident creation. This will increase the amount of automations run and support tickets avoided dashboard count once the ATR threshold is met.
To configure the Problematic and Hours count for a rule, the device will be marked as Problematic only when the rule is executed X times in X Hours.
For example, the rule Intune - Device Management Enrollment Service needs to be triggered twice in 24 hours for the device to be marked as problematic. You will need to configure End-User Mins Saved and Support Mins Saved for your dashboard metrics.
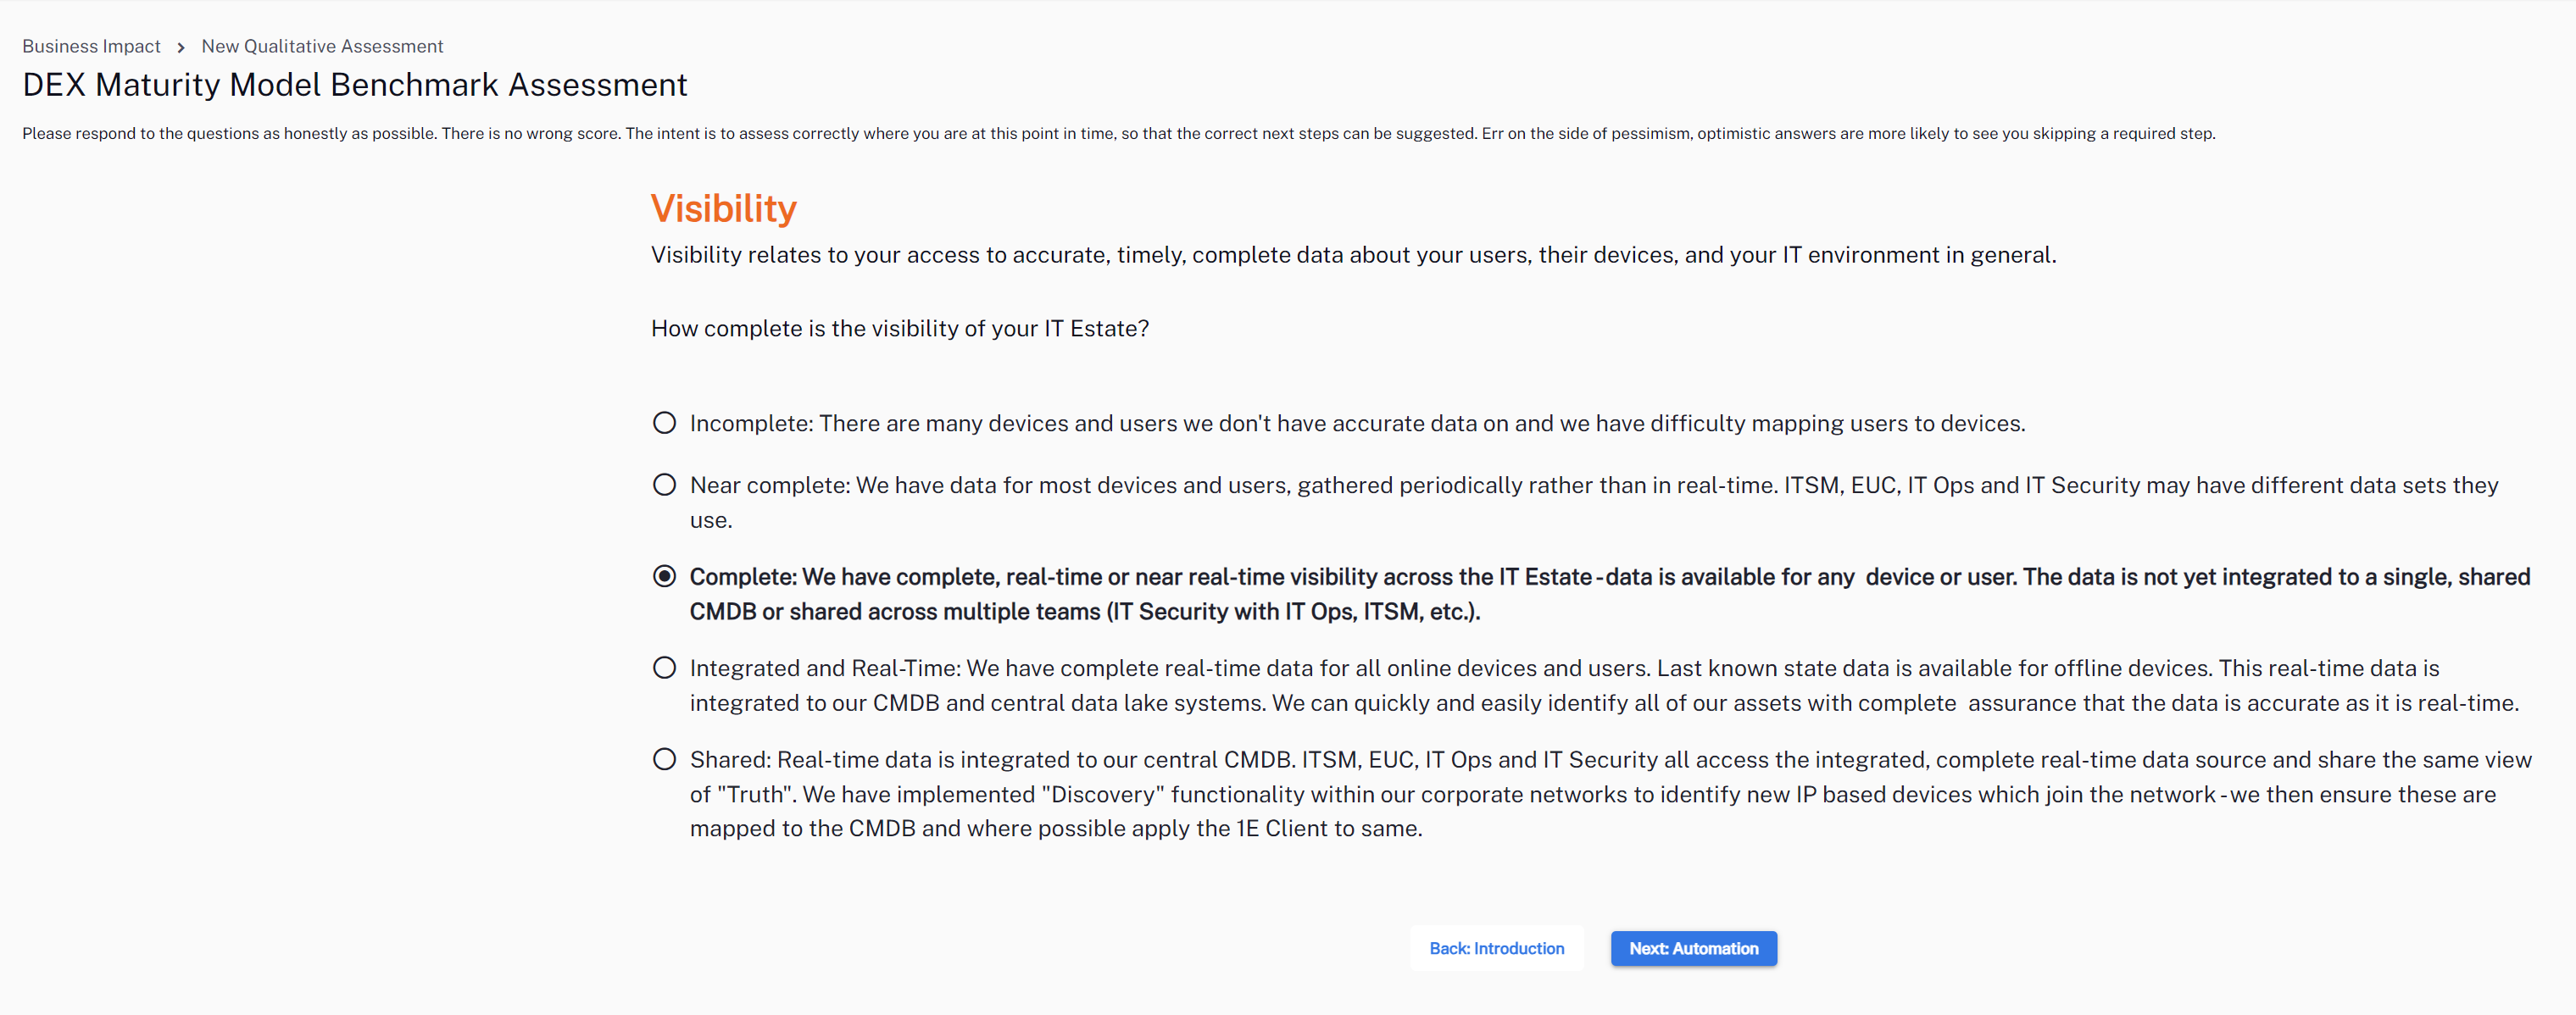
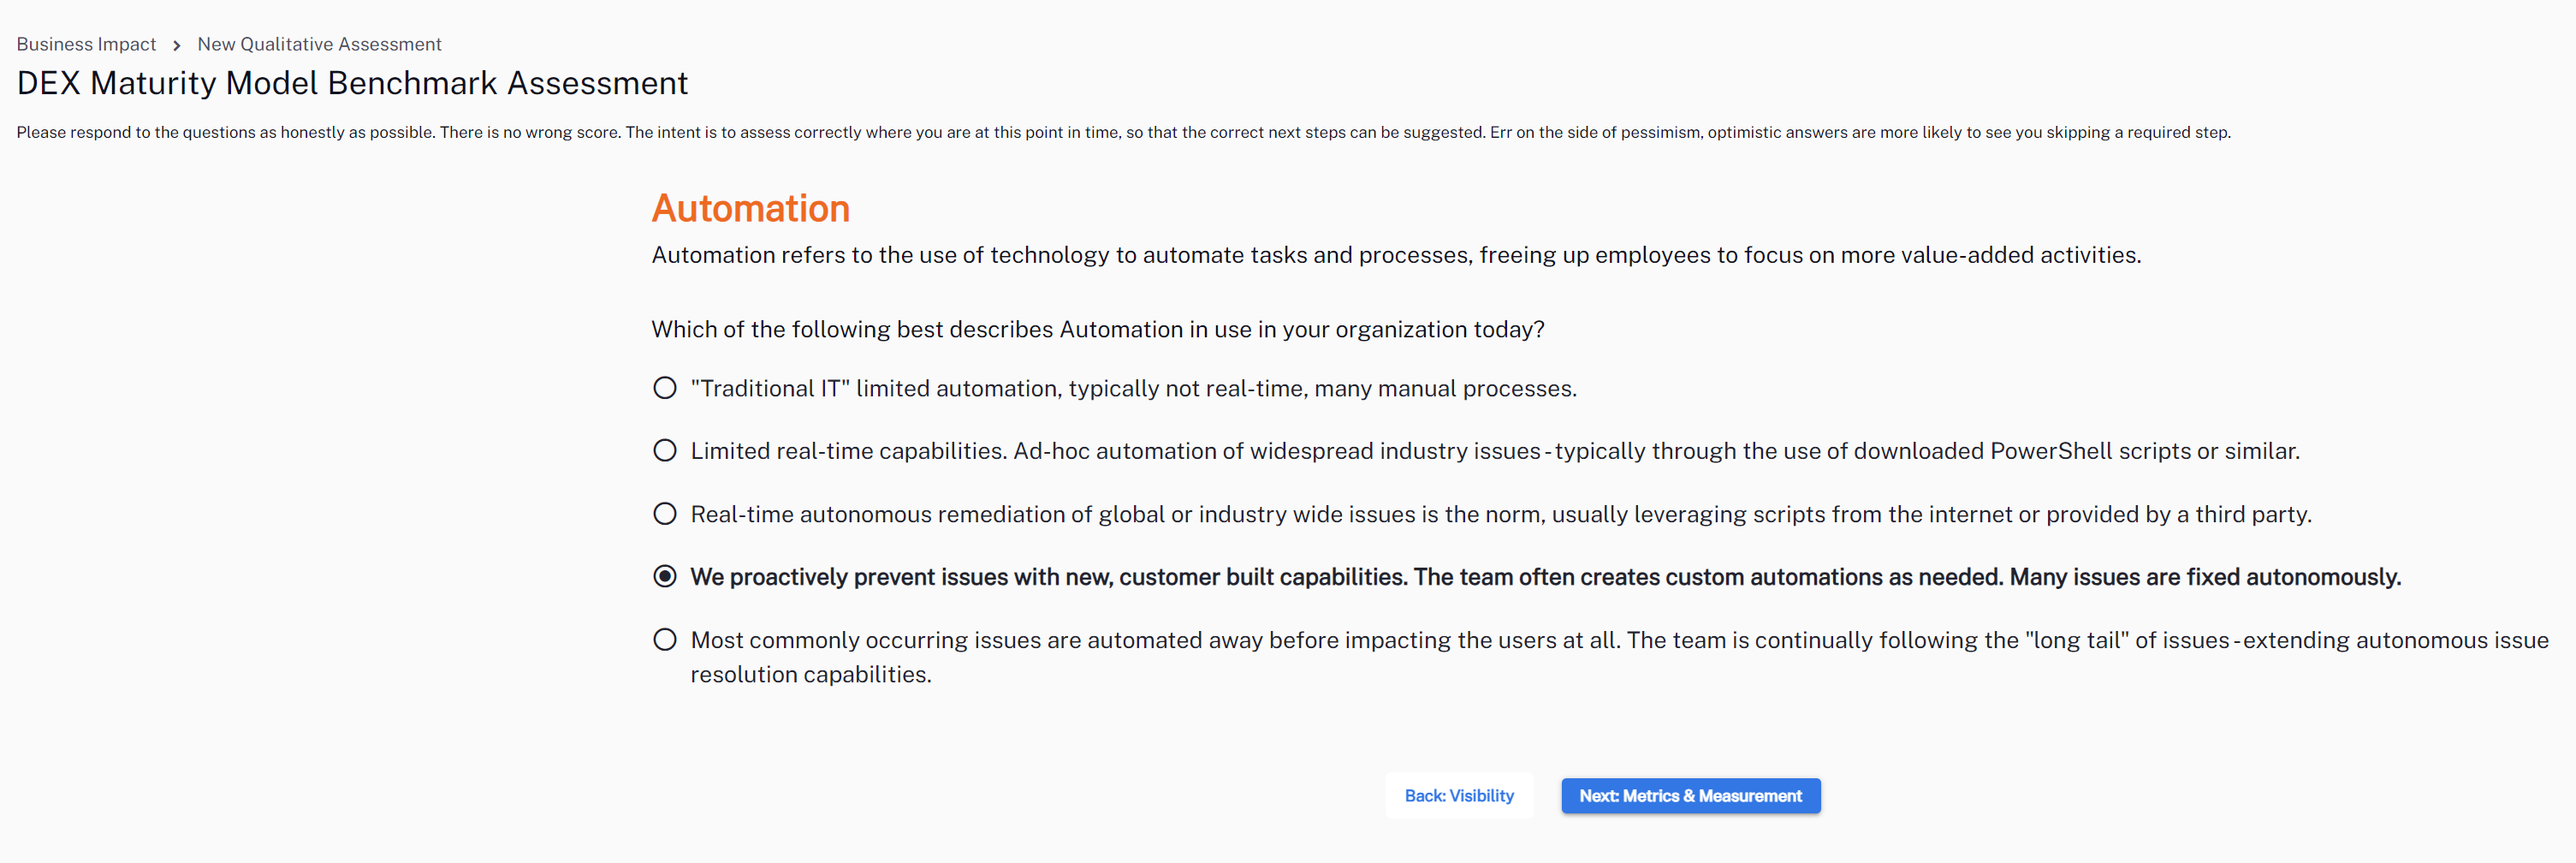
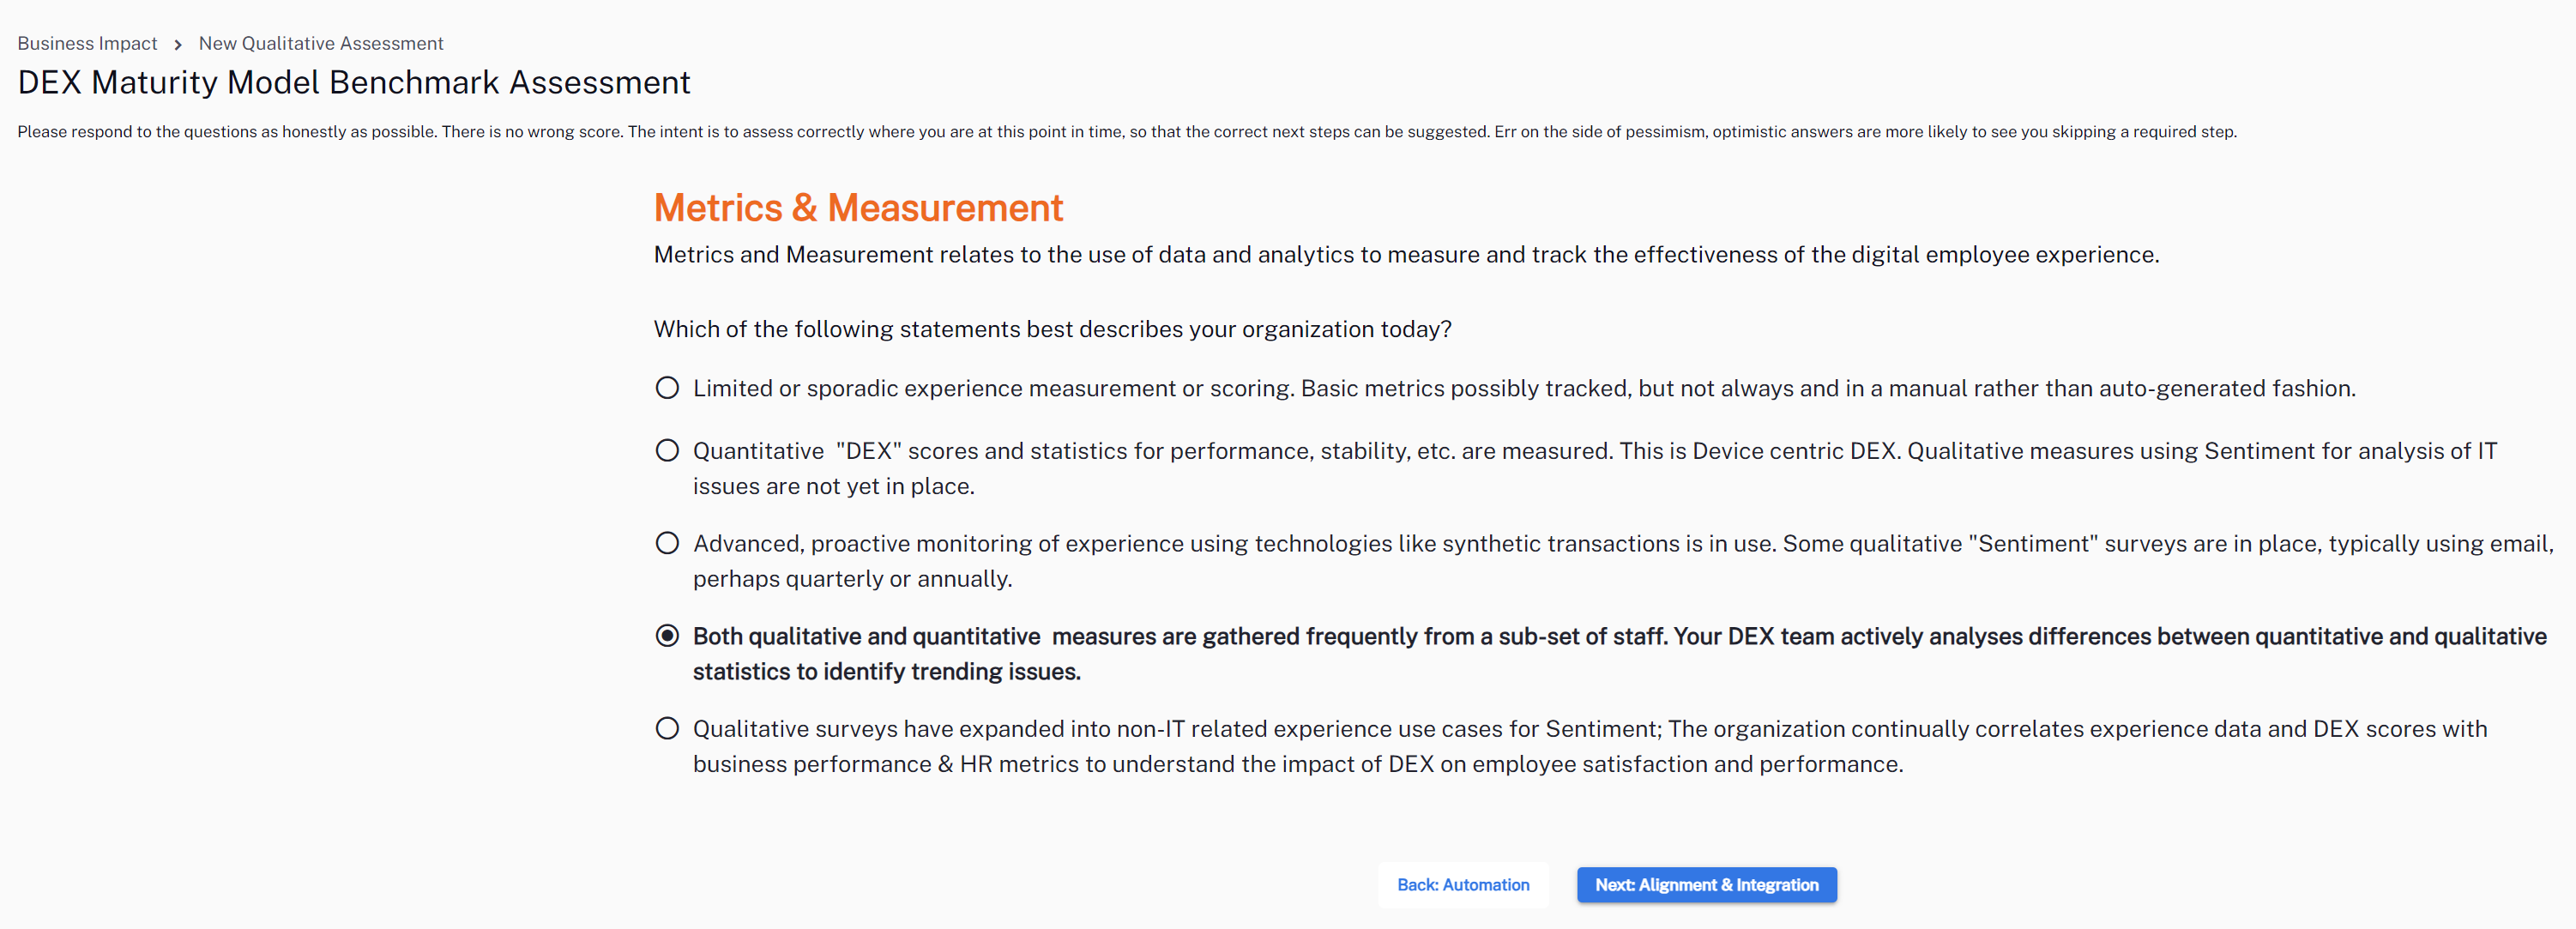
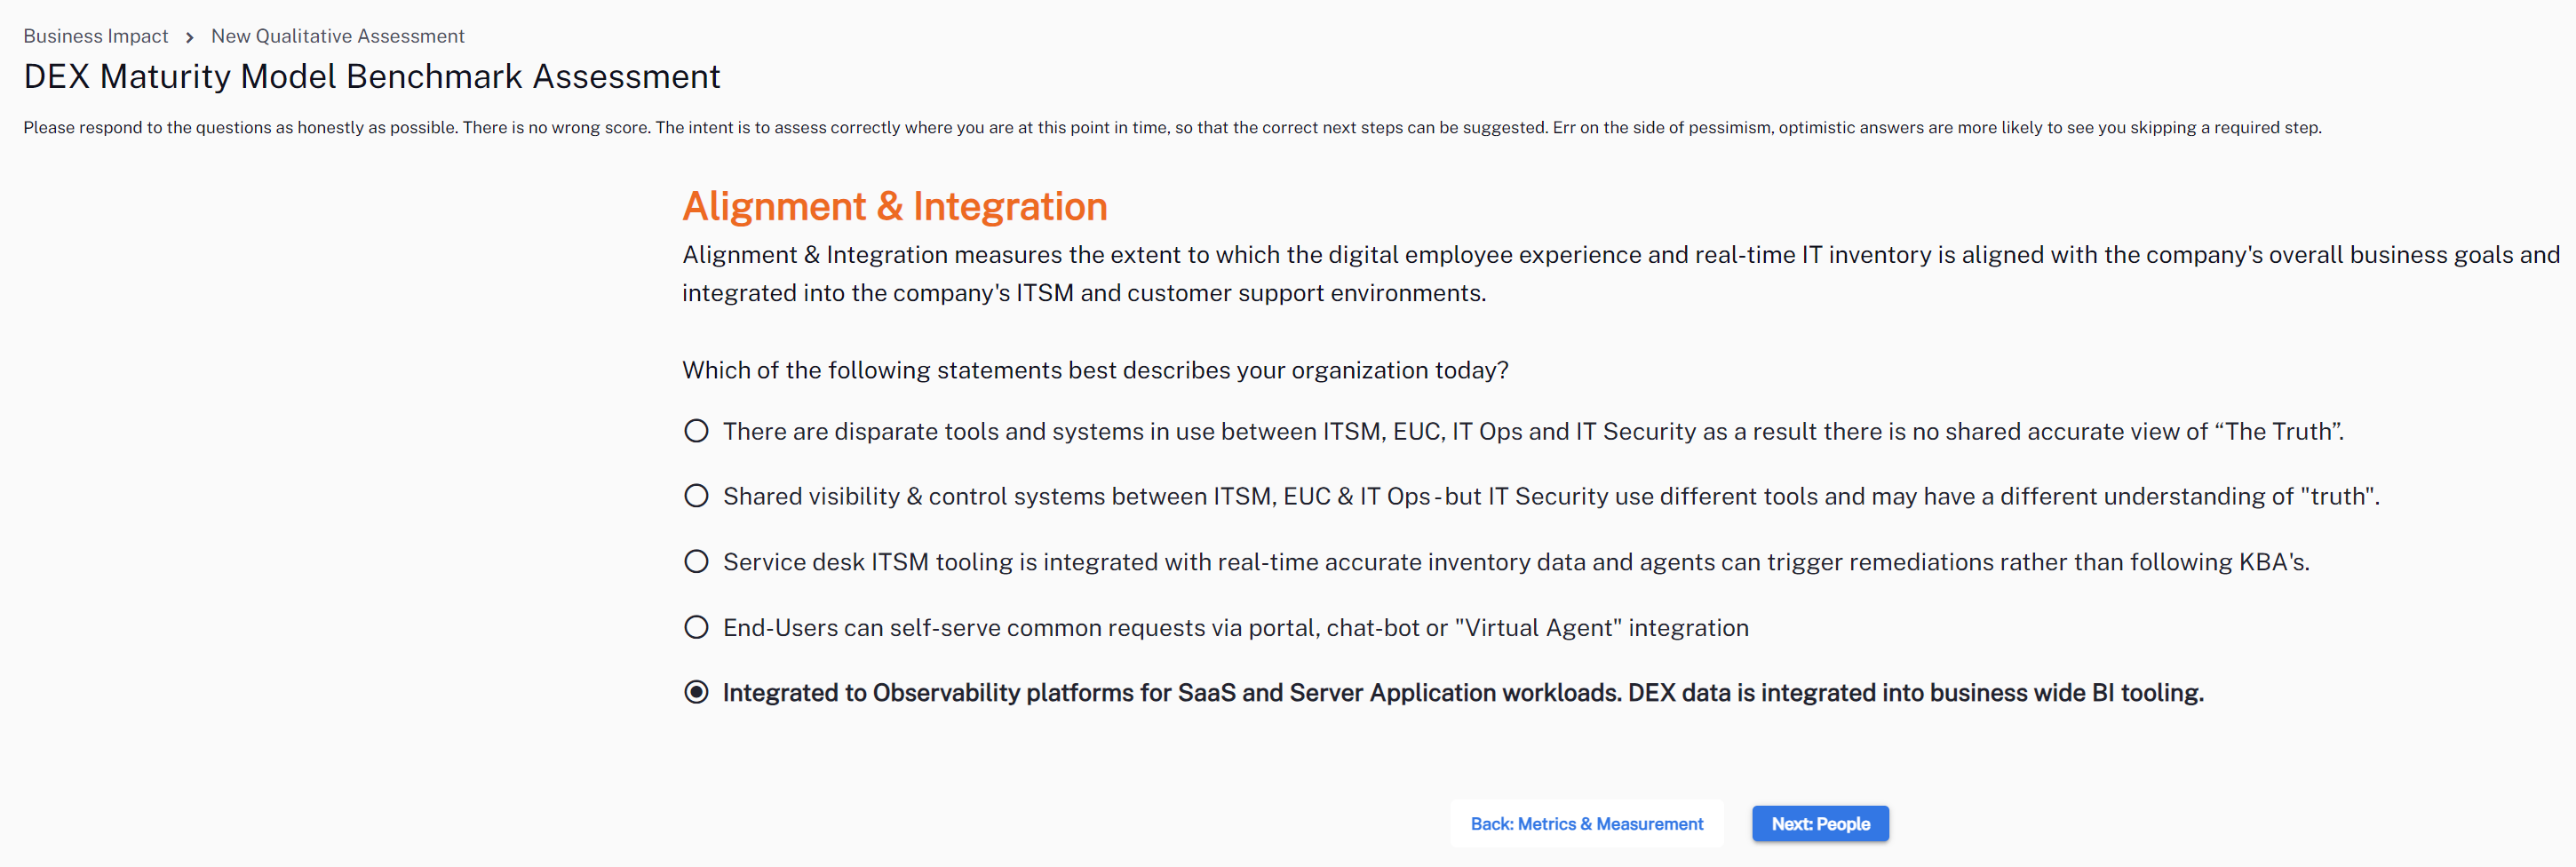
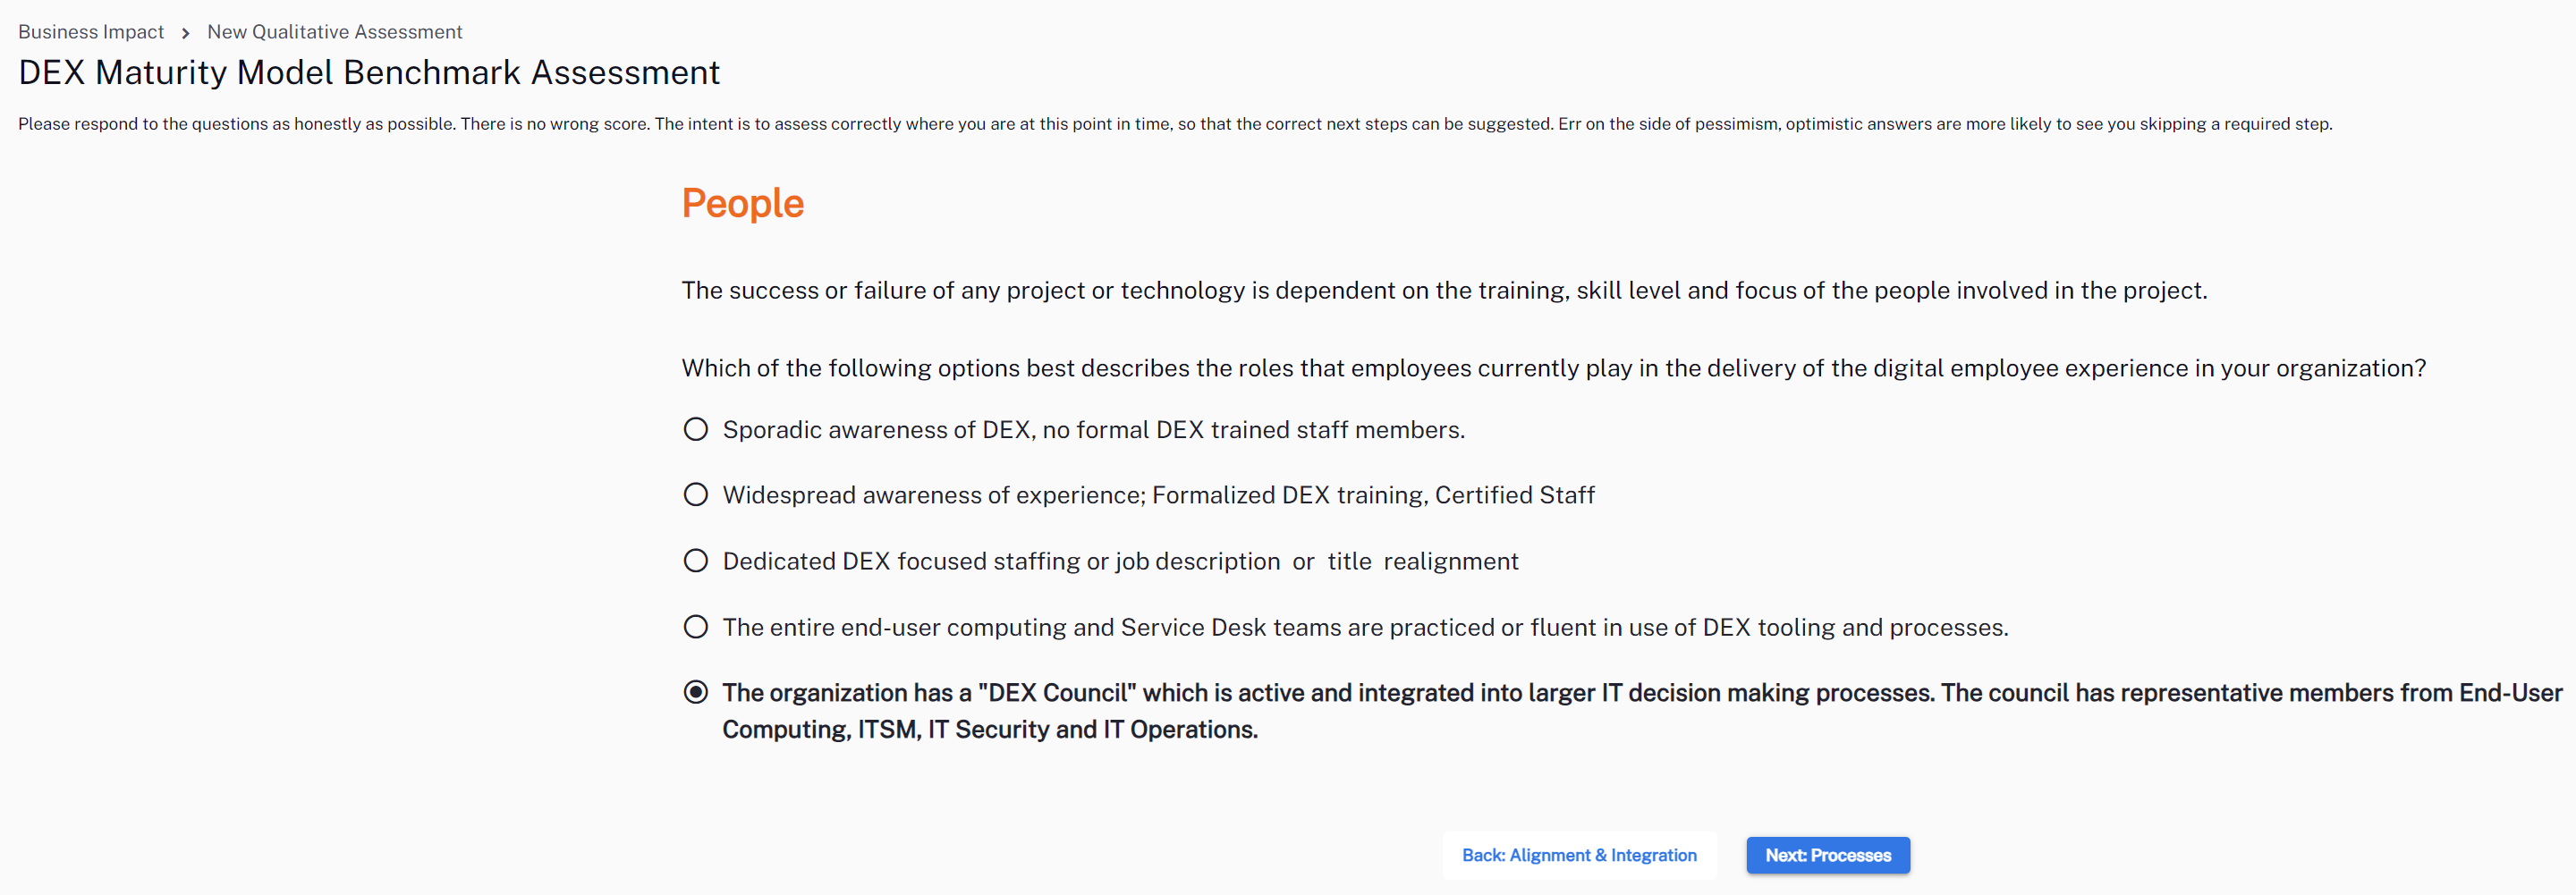
The DEX maturity model benchmark assessment helps you assess your organization's DEX maturity and monitor how this changes overtime. It also helps you identify the areas of improvement. There is an introduction to the qualitative assessment followed by a questionnaire with six questions to answer.
When you have answered the questions, click Save Responses.
DEX Maturity Matrix
After saving your DEX Maturity Model Benchmark Assessment questionnaire responses, Business Impact generates a DEX maturity matrix for your organization. This matrix provides a guide for improving your DEX maturity across the six areas covered in the questionnaire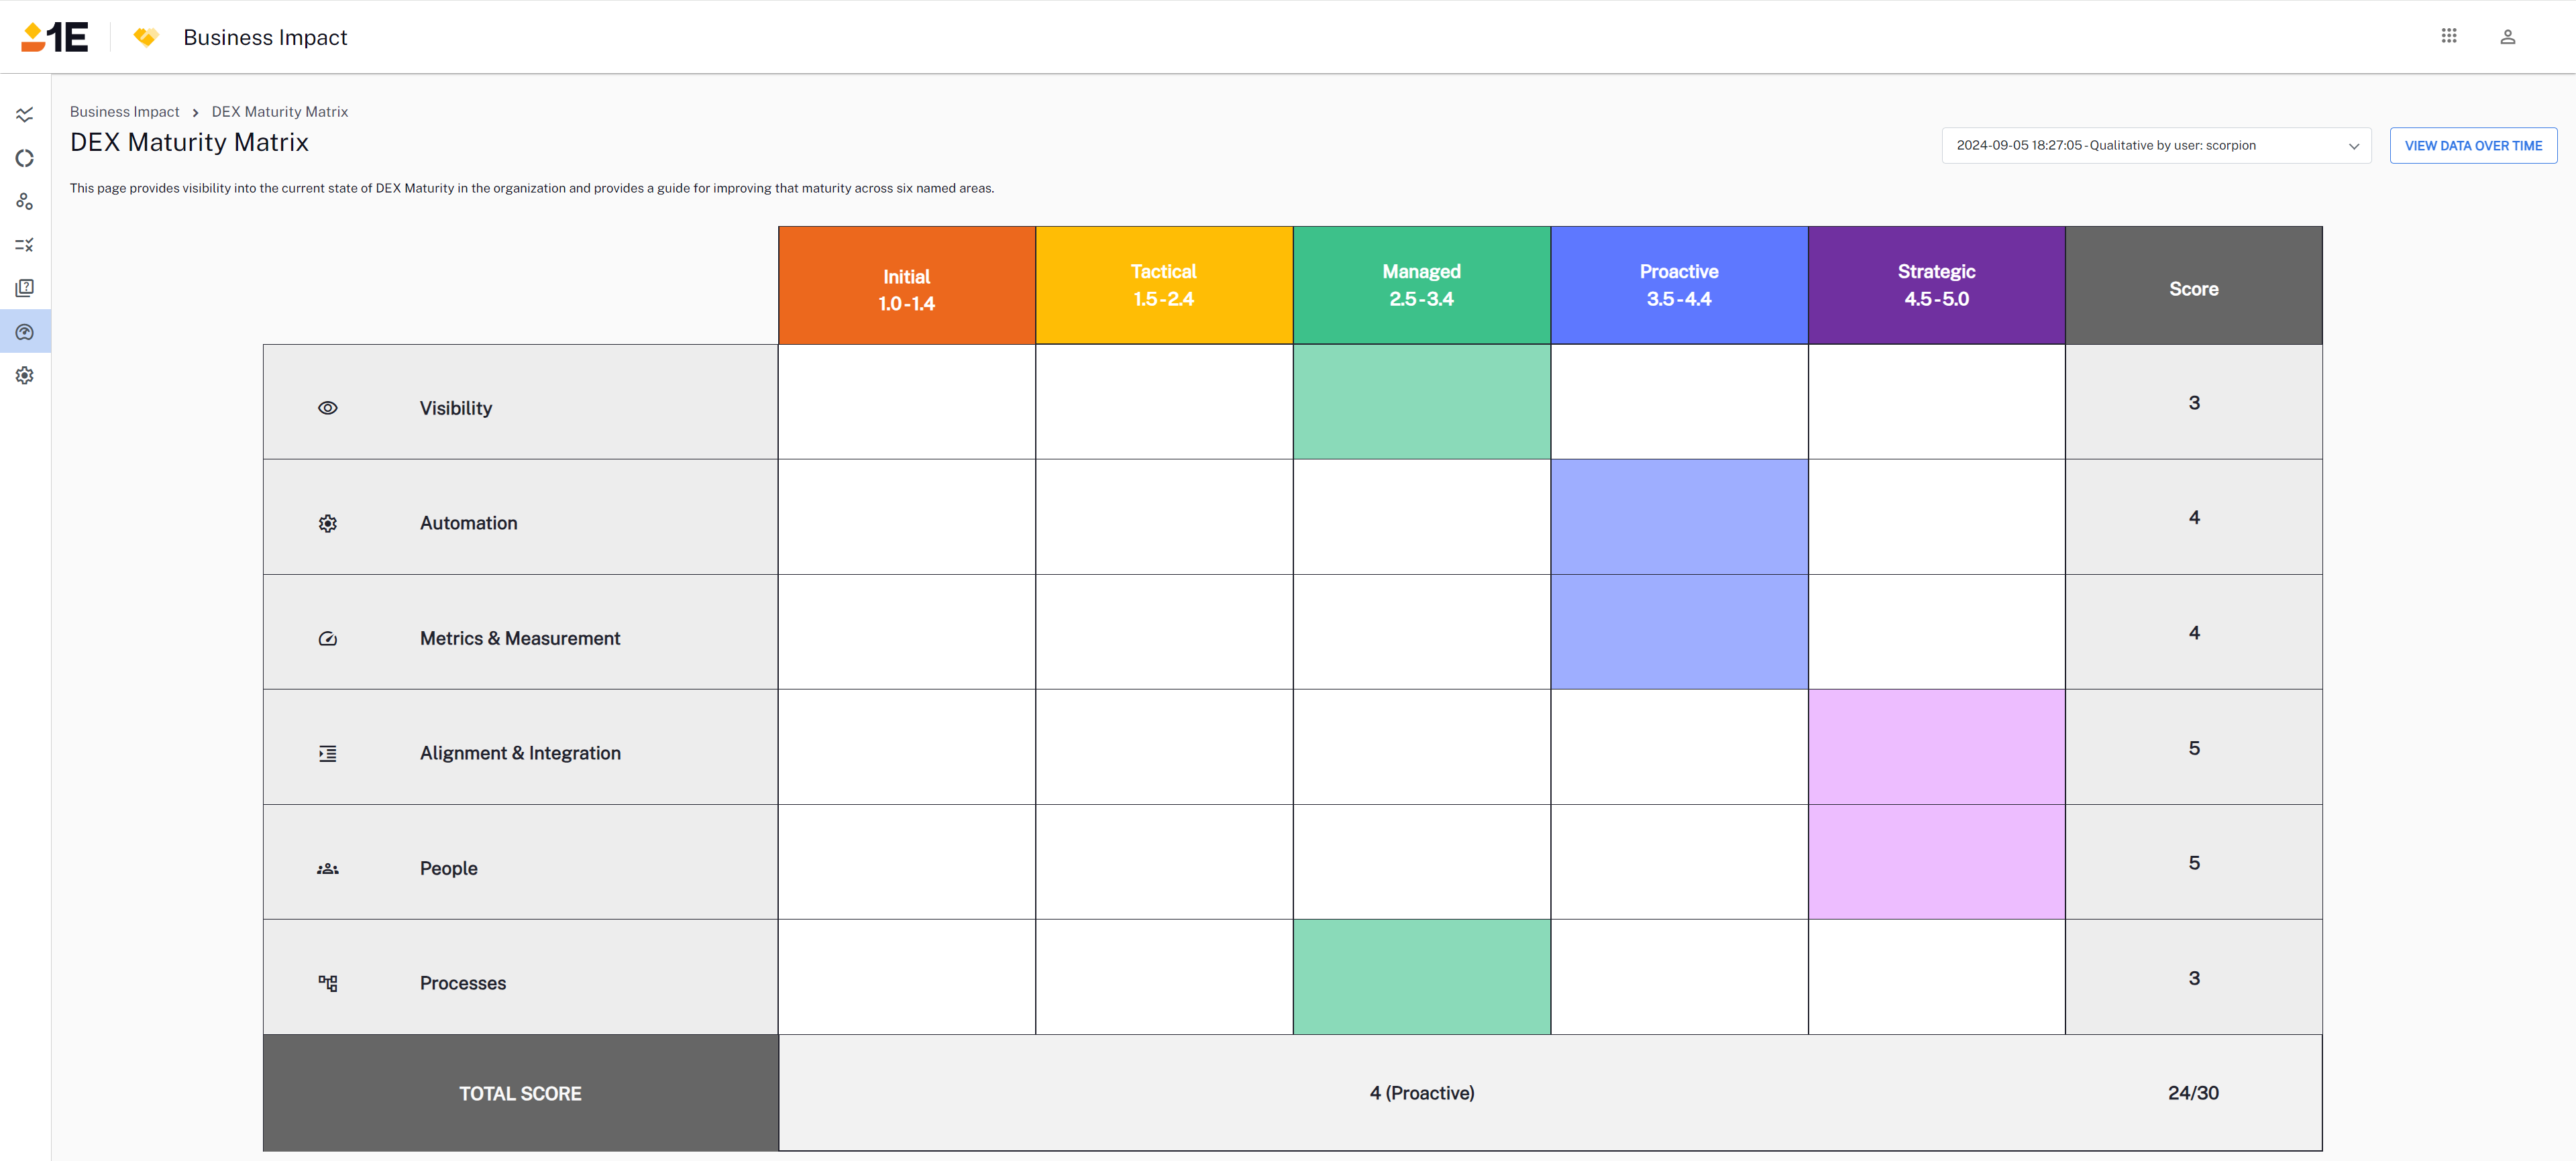
Clicking any of the cells in the matrix with a score displays its maturity matrix details.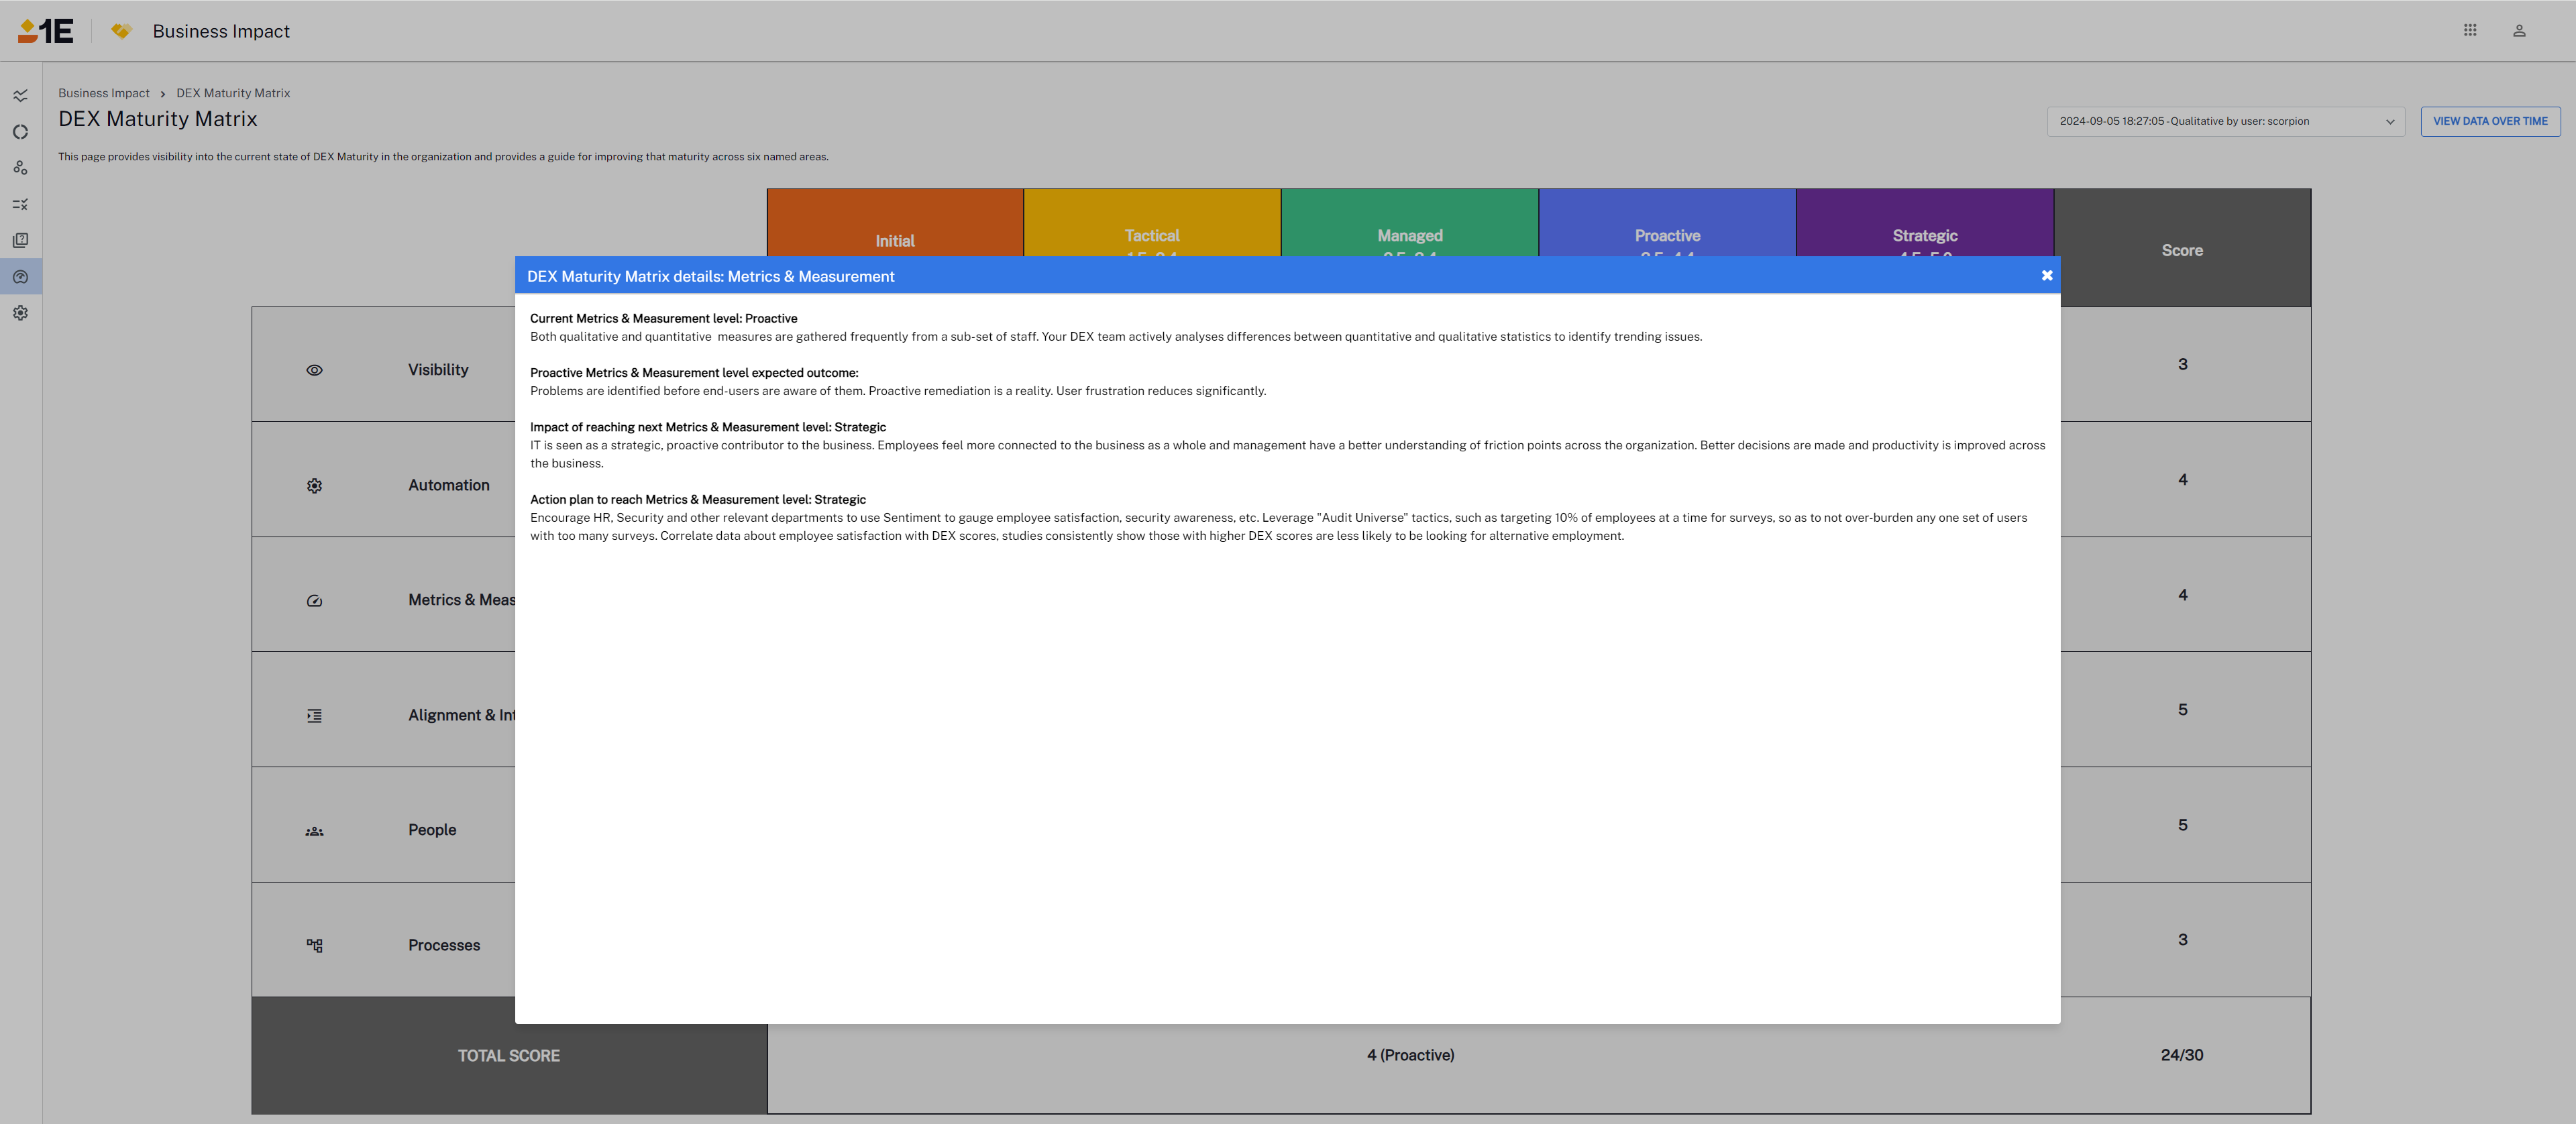
Clicking View Data Over Time and turning on Show data by area displays graphs showing DEX Maturity over time.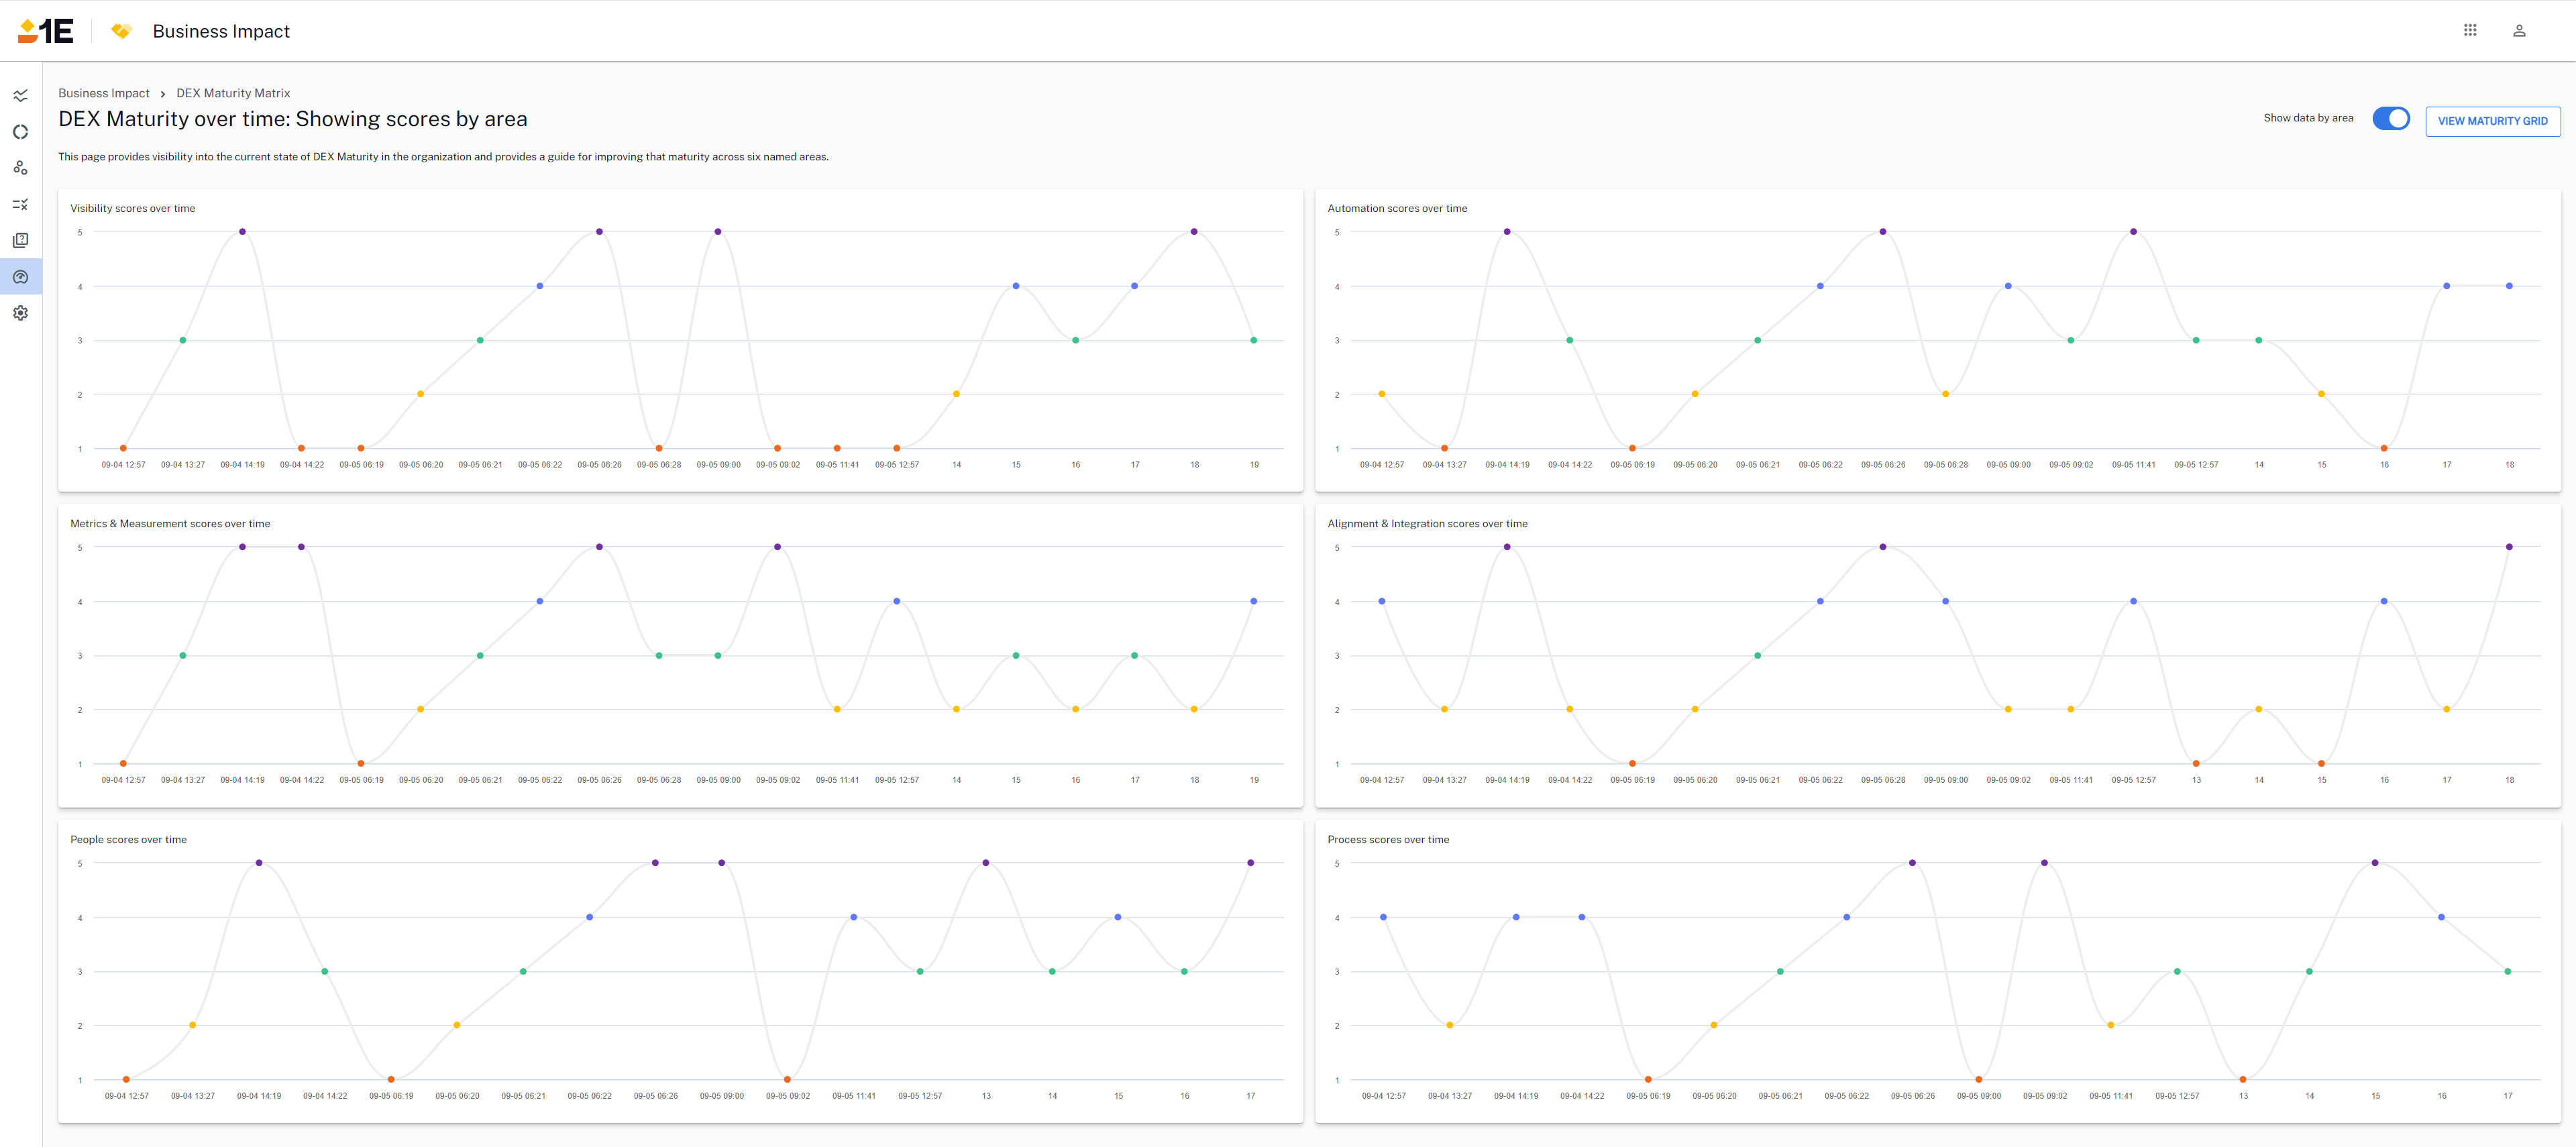
Most settings are common to all Solutions. For these common settings, refer to Solutions getting started.
Only settings specific to this Solution are covered below.
Policies and Rules
Refer to Policies and Rules.
Set support and end-user costs
Here you can set the average hourly cost for end users and support in USD for your organization.
The checkbox in the above image allows customers to optionally take the ATR (Automation to Ticket Ratio) into account and count Support Time as saved only if a ticket is created. By default this option is checked. When selected, disruption hours saved and financial savings are calculated based on the total number of automations run. This assumes that each automation helps save support time.
When unchecked, calculations are based on the estimated number of tickets avoided, using the Automation-to-Ticket Ratio (ATR). In this case, support time and cost savings are counted only through avoided tickets.
Splunk HEC Configuration
This setting lets you send specific data and events to your Splunk instance. It requires a Splunk token to authenticate your HEC connection.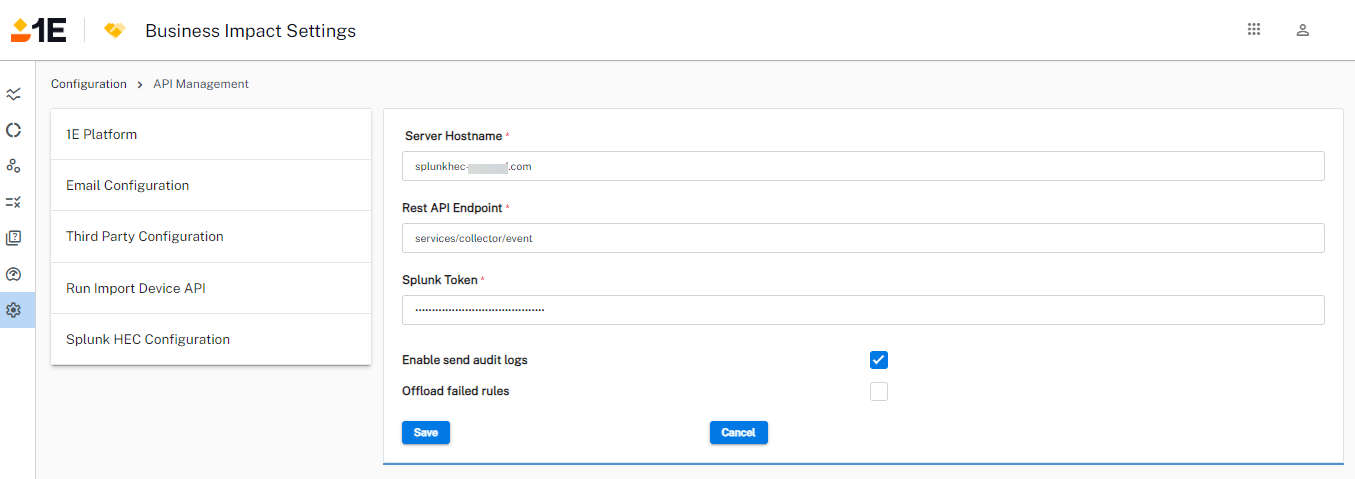
Select any of the following options:
- Enable send audit logs: Allows you to send the audit logs from the 1E Platform to Splunk. For more details about audit logs, refer to Audit information log.
- Offload failed rules: Allows you to send the failed rules from the 1E Platform to Splunk. These rules can be either check failed or check errored for checks, and fix failed or fix errored for events. For more information on rules, refer to Policies and Rules.

