Administration pages
The Administration pages allow you to create and configure Endpoint Automation policies with rules.
Policies
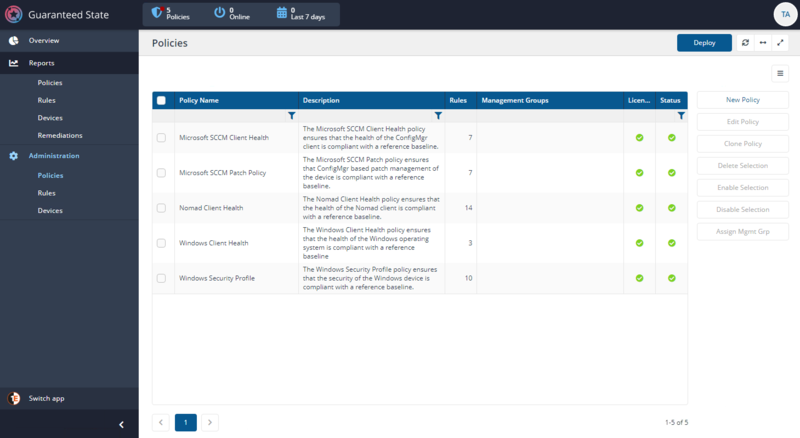
The Policies page lets you view and manage the current Endpoint Automation policies. From this page you can:
-
Create a New policy and assign and unassign existing rules
-
Edit an existing policy and assign and unassign existing rules
-
Clone an existing policy
-
Delete an existing policy
-
Enable or Disable an existing policy
-
Assign (or unassign) an existing policy to one or more Management Groups
Rules
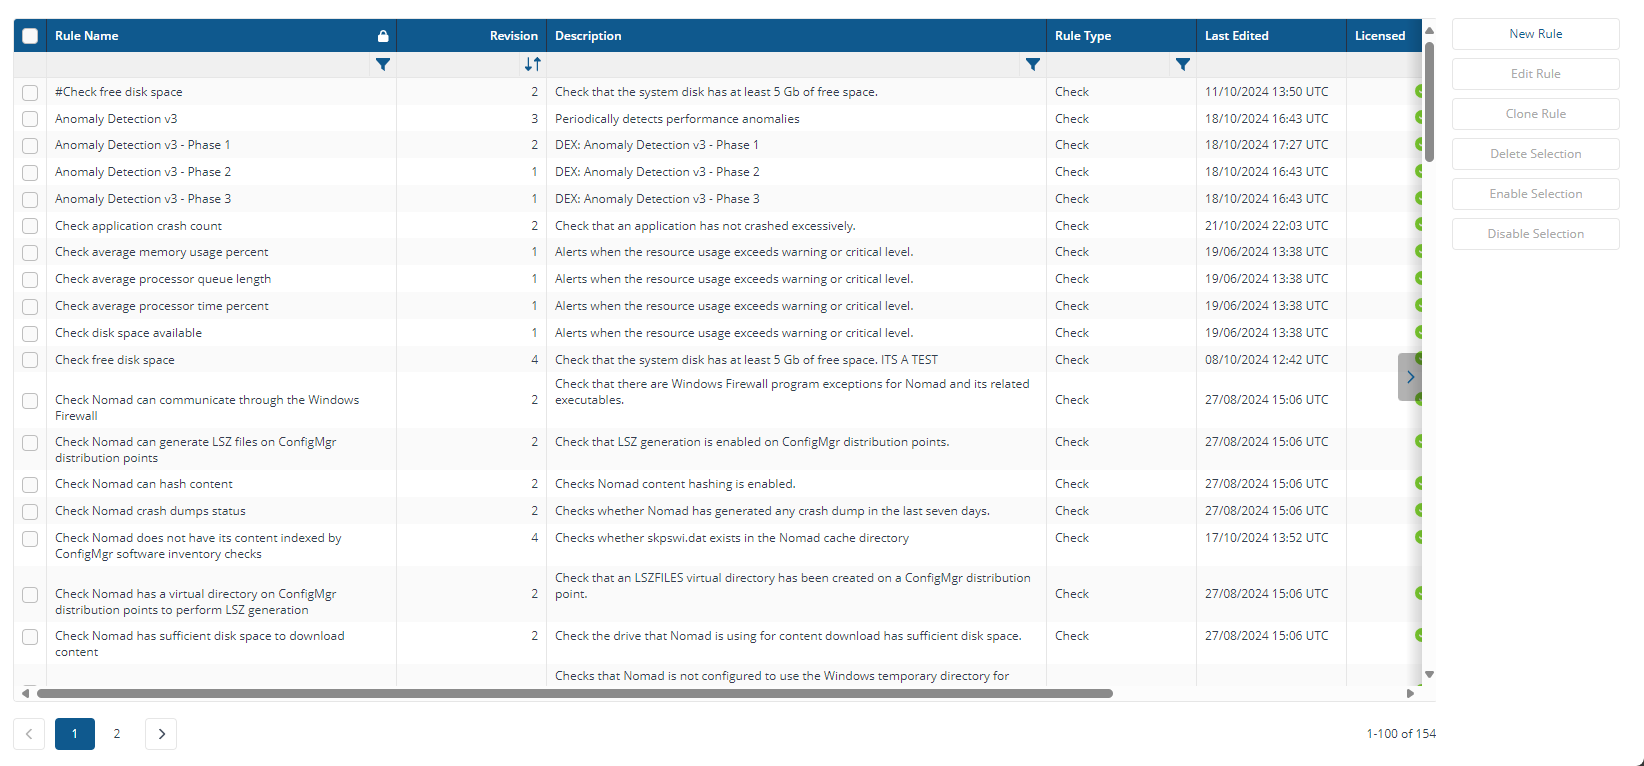
The Rules page lets you view and manage the Endpoint Automation rules. From this page you can:
-
Create a New rule and configure it
-
Edit an existing rule and configure it
-
Clone an existing rule with a new name
-
Delete an existing rule
-
Enable or Disable an existing rule
Devices page and Devices view
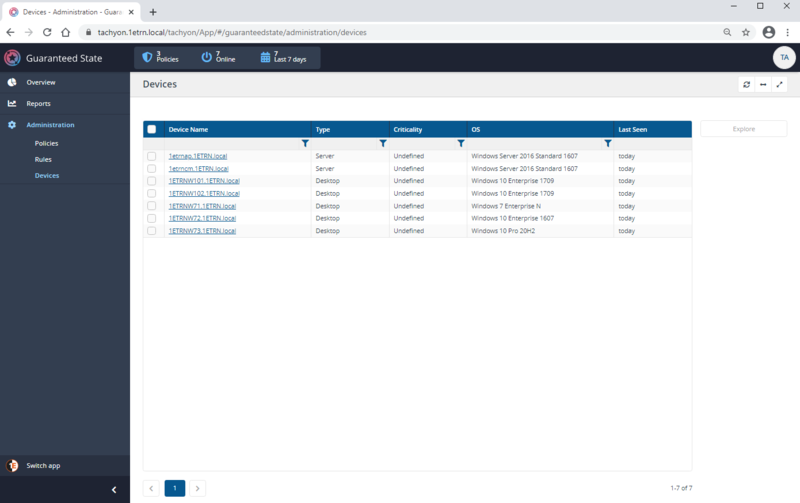
The Devices page provides a list of all devices visible to Endpoint Automation. You can display a Device view for a selected device by clicking on its link in the Device Name column. You can also select one or more entry from the list and choose to use that selection as the scope for an Endpoint Troubleshooting session.
The Devices view Policies tab
The default view in the Endpoint Automation devices view is Policies. The remaining tabs display information corresponding to an app, feature or data set implemented in 1E Platform. Other tabs are visible if an app has been installed and licensed, and the user has permissions to use the app.
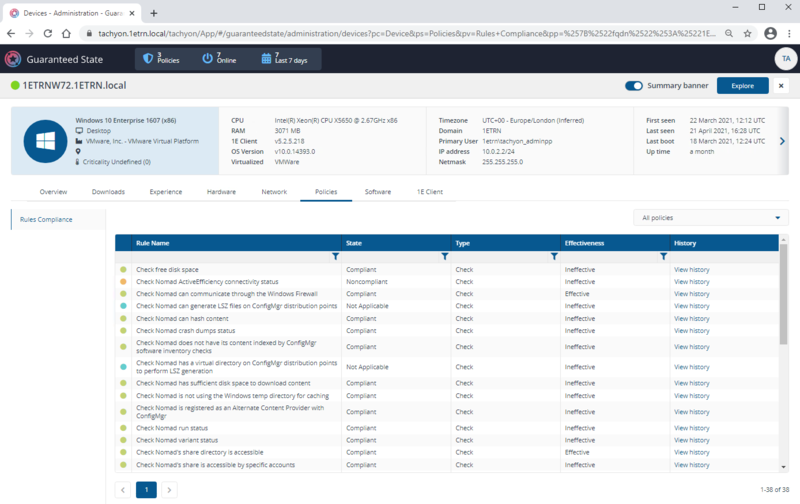
Clicking on one of the links in the Device Name column of the Devices page displays the Device view for the selected device. The aim of the Device view is to provide a combined overview of all the information known about a device along with the ability to retrieve information about the device in real time. When displaying the Device view from a Endpoint Automation page the view defaults to the Policies tab. The Policies tab contains information derived from and useful for using Endpoint Automation.
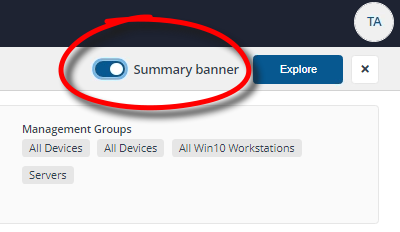
The Summary banner toggle at the top of the page (the default toggle setting is off), shows general device details, and the Explore button navigates you to 1E Endpoint Troubleshooting, refer to Endpoint Troubleshooting.
Is the Device is online and connected to 1E
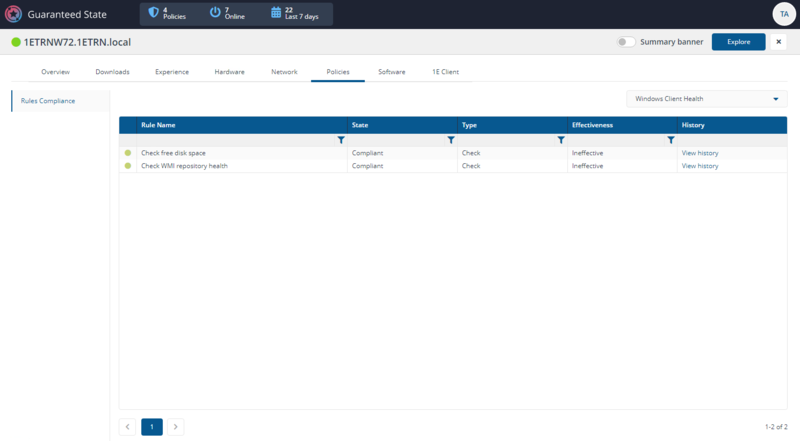
In the picture opposite the device 1ETRNW72 is showing as online and connected to 1E, this is indicated by the green traffic light next to the device name at the top of the page. Hovering your mouse over the traffic light displays the message This device is online and connected to 1E Platform.
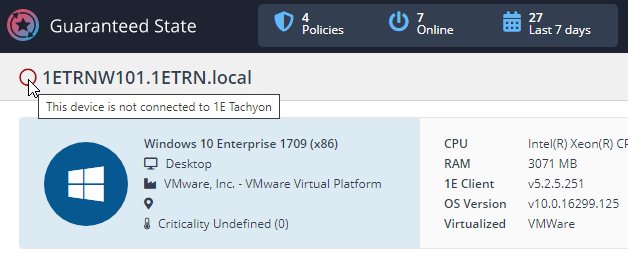
In the picture opposite the device 1ETRNW101 is showing as not connected to 1E, this is indicated by the gray traffic light next to the device name at the top of the page. Hovering your mouse over the traffic light displays the message This device is not connected to 1E Platform.
Device view table
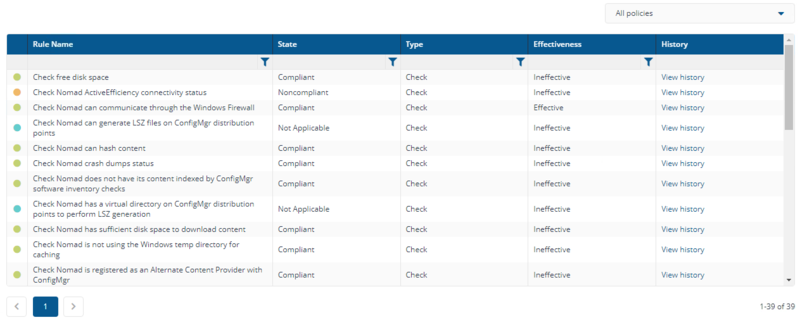
In the Device view you can see if a device is compliant to the rules deployed in your environment, if they are effective and view information to assist with troubleshooting.
|
Column |
Description |
|---|---|
|
Traffic light |
Traffic light status relates to the State column. Green - Device is Compliant Orange - Device is Noncompliant Blue -Device is Not Applicable. |
|
Rule Name |
Name of a specific rule. |
|
State |
Device state per rule, for example: Compliant - rule check passed. Noncompliant - rule check failed. Not Applicable - rule precondition did not pass. |
|
Type |
Whether the rule is one of two types: Fix - allows you to define a desired state for the device and then enforce that state. For example, you could mandate that a registry key exists and contains a specific value. Again, you can report on the application of these fix rules to devices. Check - allows you to verify that a device has a particular state, such as a registry key having a specific value. You can then view summary and detail reports which show devices that are compliant and not compliant with the check rules. |
|
Effectiveness |
Rule effectiveness, either: Effective - the rule has been deployed and at least one device has changed its compliance position for this rule in the last thirty days Ineffective - the rule has been deployed, but no devices have changed their compliance position for this rule in the last thirty days. |
|
History |
Clicking View history displays the related history per rule for the selected device. Timestamp - for example 29-04-2021 11:34:01 UTC Status - if the Check or Fix failed or passed Data - details related to the event. For example, a message related to the rule Check Nomad's share directory is accessible , with a Check Failed message showing as the Status might return a message like, Permissions on the Nomad share are not valid. |
Policies filter
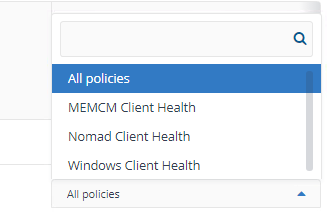
You can use the policies filter to differentiate between device compliance for the different policies you have deployed in your environment, the default view is All Policies.
In our example we have deployed three policies:
-
MEMCM Client Health
-
Nomad Client Health
-
Windows Client Health
In the example we have filtered the view on the Windows Client Health policy which shows two Rules:
-
Check free disk space
-
Check WMI repository health
The Device view Summary banner
The Summary banner displays a quick summary of the information provided in the various tabs displayed in the Device view. It can be viewed by toggling the Summary banner switch to on.
The following image shows the Summary banner displayed for a particular device.
Launching Endpoint Troubleshooting from the Device view
You can click on the Explore button in the Device view to launch Endpoint Troubleshooting with the current device set as the scope.
Closing the Device view
The Device view is a popup that is displayed when clicking on the name of a device on a page where devices are displayed. To return to the page you came from you need to click the x button.
Additional Device view tabs
In addition to the Policies tab, there are a number of other tabs, each corresponding to an app, feature or data set implemented in 1E Platform. The Overview and 1E Client tabs are always present in the Device view. Other tabs are visible if an app has been installed and is licensed.
Each tab has one or more panels with tiles populated with data from various sources, some by instructions that are run instantly, with results cached for 3 minutes. An appropriate error message is displayed instead of a tile in the following circumstances:
-
If the device is offline, as indicated by the color of the icon in the top left
-
The user does not have at least Viewer permission to view use the license the tab or panel
-
The user does not have questioner permission to run the instruction
-
An instruction has not been uploaded
The Device View tabs and panels page lists the names of tabs and their panels, and a description of each tile indicating how the tile is populated.
