Investigating devices
 |
| 
Investigate endpoint issues using Endpoint Troubleshooting to diagnose device health, review diagnostic data, and identify the root cause of common problems. This guide explains the available investigation tools, device insights, and troubleshooting workflows that help administrators resolve issues faster and improve endpoint reliability across the Platform.
 Overview
You can use the Devices section to browse a predetermined set of information for all the devices that are known to the Platform, that is the devices that are currently connected or have connected in the past. This is in addition to the ability to explore devices using instructions to get back a range of information that is only limited by the instructions you have available to you.
The Devices section can be viewed by users assigned to any role that has permissions on any instruction set. This includes custom roles and the following system roles:
-
All Instructions Actioner
-
Full Administrator
-
All Instructions Approver
-
All Instructions Questioner
-
Viewer
There are two options for directly investigating the devices known to the Platform are Devices table and Investigating devices.
Devices table
Endpoint Troubleshooting lets you view details for devices on your network, including real-time visibility of which devices are currently connected (online) and can therefore be interacted with directly.
1E-Explorer-TachyonAgent DEX Pack contains Instructions that help with device connectivity and configuration. You can download this DEX Pack, and others from the TeamViewer DEX Hub.
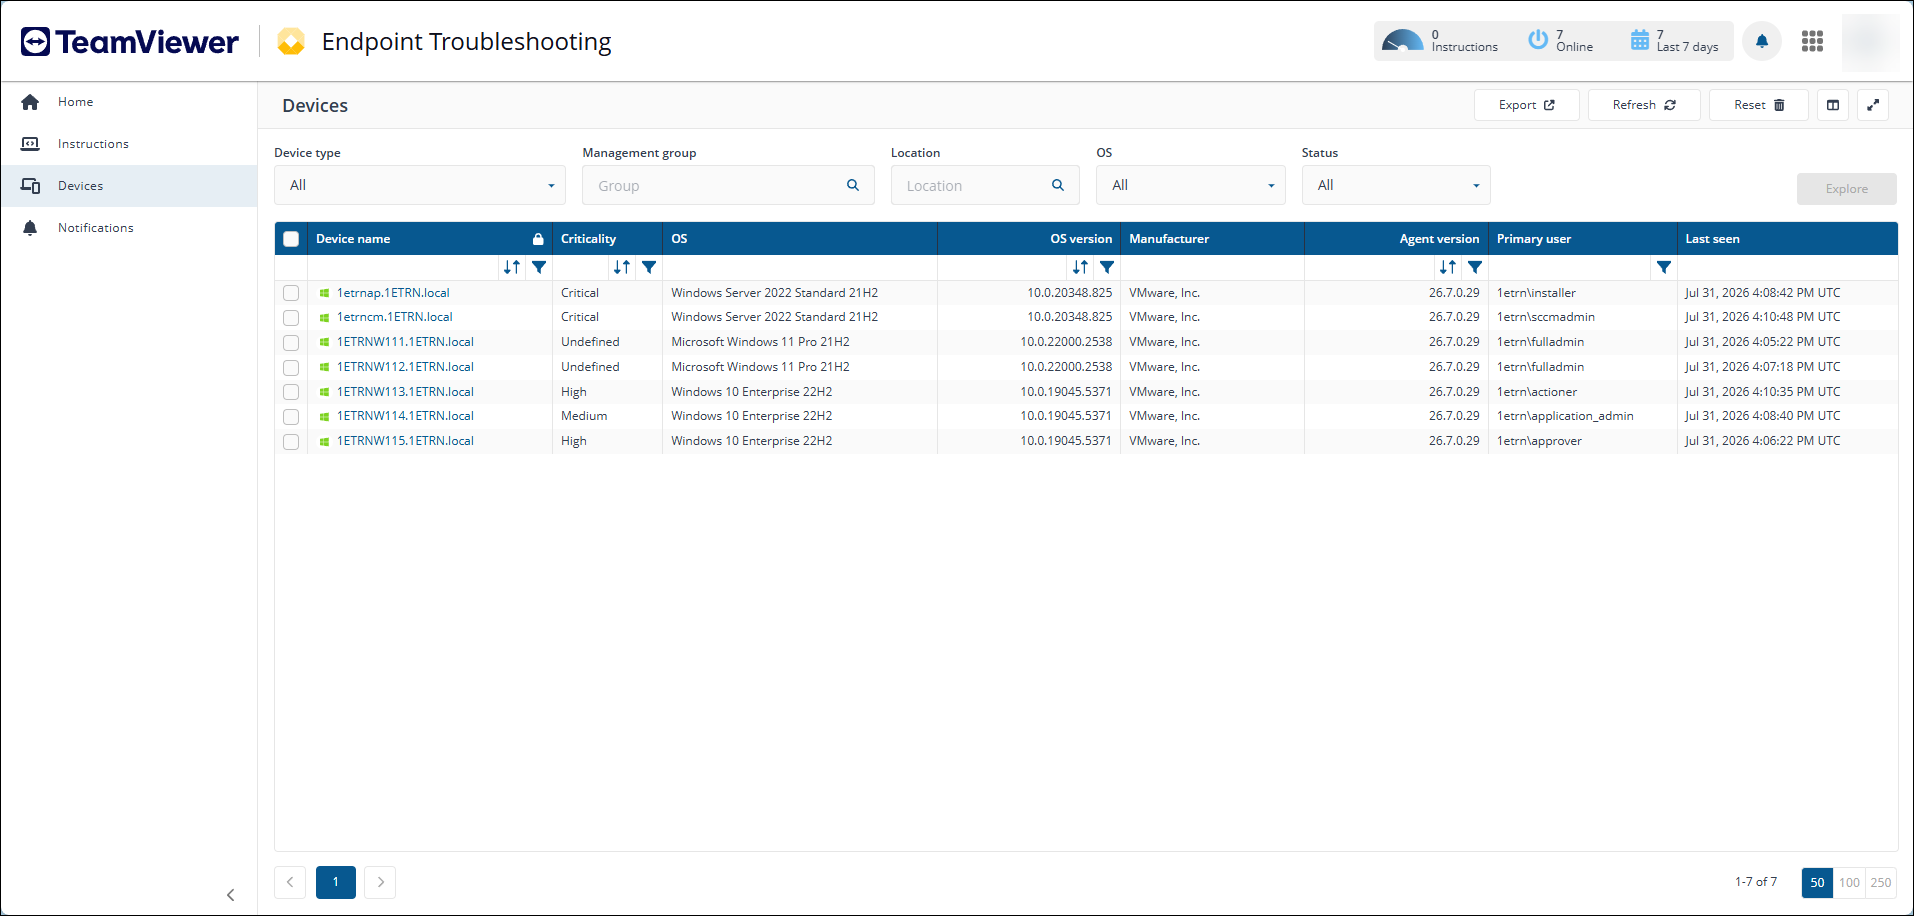
The picture shows the devices that have connected to our example Platform. They are all shown as currently online. Each time you view or change the page, the table is refreshed. You can also click Refresh while viewing the table.
-
Status: Indicates the status of the device:
-
online: The device is connected to a Switch.
-
offline: The device does not have a network connection to a Switch. This may be because the device is powered down, disconnected from the network, the 1E Client is not running or is incorrectly configured.
-
-
Device name: The Fully Qualified Domain Name (FQDN) of the device, as presented by the device to the Switch.
If the FQDN of a device changes then it will be updated in the TachyonMaster database, it does not create a duplicate entry. Each device is uniquely identified by a GUID which is not visible in any screens.
You can view additional properties for a device by clicking on the information
 icon next to the device name - see Overview tab.
 - Criticality: The criticality of the device as determined by your organization. Refer to Using device criticality.
-
OS: The Operating System name.
-
OS version: The Operating System version.
-
Manufacturer: The manufacturer of the device as it appears in the device BIOS. The name is not normalized.
-
Agent version: The version of the 1Eagent.
-
Primary User: The Primary User that the 1E agent has determined is most clearly related to the device.
-
Last seen: The date and time when the device last reported a Keep Alive to the Switch, which is at least every 15 minutes by default, as defined in 1E Client, ConnectionKeepaliveTimeInSecondsMax.
Sorting the table
Click on Sort by and select one of the following properties, to sort the Devices table.
-
Device name: Sorts on the device name in A-Z or Z-A order.
-
OS: Sorts on the OS name in A-Z or Z-A order.
-
Agent version: Sorts by the version number of the 1E Client in ascending or descending order.
-
OS version: Sorts on the OS version number in ascending or descending order.
-
Criticality: Sorts on the device Criticality, ascending or descending according to the following order:
-
Undefined
-
Non-critical
-
Low
-
Medium
-
High
-
Critical
-
Filtering the table
You can filter rows of the table using the following properties. A button turns blue if it is being used. You can click on Reset to delete all the filters.
-
OS: A drop-down list let's you filter on one of the following OS:
-
All
-
Windows
-
Linux
-
Mac
-
Android
-
Solaris
-
-
Agent version: This drop-down lets you filter on the version number of the 1E Client using a numeric condition, as described under the heading Numeric conditions.
-
OS version: This drop-down lets you filter on the OS version number using a numeric condition, as described under the heading Numeric conditions.
-
Device type: This drop-down lets you filter on one of the following device types:
-
All
-
Desktop
-
Laptops
-
Servers
-
Mobiles
-
-
Status: This drop-down lets you filter according to whether the device is currently Online or Offline.
-
Criticality: This drop-down lets you filter according to the Criticality set for the device. For more detail about this feature, refer to Using device criticality.
-
Undefined
-
Non-critical
-
Low
-
Medium
-
High
-
Critical
-
-
Management group: This entry field lets you filter according to a Management group that devices belong to. A list of Management groups is displayed when you click in the entry field, or you can type a name to filter the list as you type.
-
FQDN: This entry field lets you enter all or part of the Fully Qualified Domain Name for devices, and dynamically refreshes the table as you type.
-
Location: This entry field lets you filter on the location set for the devices, and dynamically refreshes the table as you type.
-
Primary User: This entry field lets you filter on the Primary User that the 1E Client has determined is most clearly related to the device, and dynamically refreshes the table as you type.
Numeric conditions
-
Equals: Checks if the property is equal to the value you supply.
-
Greater: Checks if the property is greater than the value you supply.
-
Less: Checks if the property is less than the value you supply.
-
Range: Checks if the property lies between the upper and lower bounds you supply.
Exporting the table
You can export the devices data to a .csv file, as described in Exporting data from Endpoint Troubleshooting.
Device view
Clicking the device name in the Device Name column of the Devices Table page displays the Device view for the selected device. The aim of the Device view is to provide a combined overview of all the information known about a device, along with the ability to retrieve information about the device in real-time.
Overview tab
When displaying the Device view from the Endpoint Troubleshooting > Devices table, the view defaults to the Overview tab. This tab contains the following panels.
Details
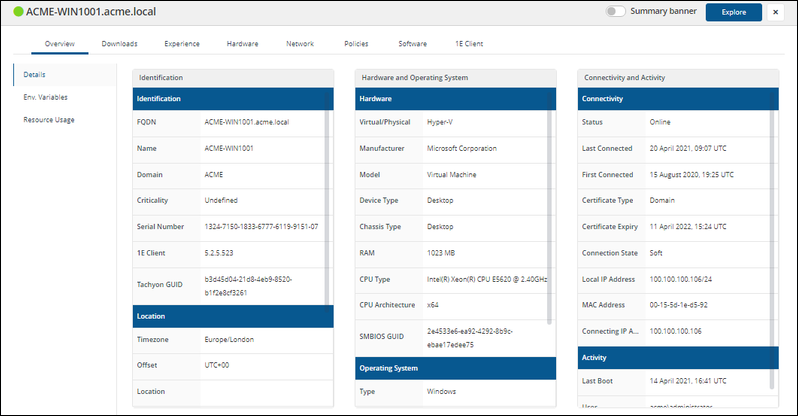
This panel displays the basic details for the device. This is contained in a number of tiles, as described in the following sections.
If you upgrade macOS to a new major version (For example, 11 to 12) then the O/S install date will change. However, if the upgrade is a minor version, such as 12.2 to 12.3 then the install date remains the same as the original major upgrade.
Identification
Identification:
Display's the current device:
-
FQDN: The FQDN for the device.
-
Name: The server name for the device.
-
Domain: The device's domain.
-
Criticality: The Platform set criticality value for the device.
-
Serial Number: The device serial number.
-
1E Client: The version of the 1E Client installed on the device.
-
Tachyon GUID: The GUID used by the Platform to uniquely identify the device.
Location:
Displays the device's:
-
Timezone: The timezone the device is operating in.
-
Offset: The offset from UTC for the timezone the device is operating in.
-
Location: The device location, if any has been set.
-
Locale: The language locale set for the device.
Grouping:
Information on how the device has been tagged and grouped from a Platform perspective.
-
Tags: Indicates all Platform tags that have been set for the device.
-
Coverage Tags: Indicates Platform tags that have been set for the device that can be used to determine coverage for an instruction.
-
Mgmt. Groups: Indicates the Management Groups the device belongs to.
Hardware and Operating System
Information on the device's hardware.
-
Virtual/Physical: Indicates whether the device is virtual or physical. For virtual devices it indicates the type of virtualization. For example Hyper-V.
-
Manufacturer: Shows the hardware or virtual device manufacturer. For example Microsoft Corporation for Hyper-V virtual devices.
-
Model:The model of the hardware or virtual device. For example Virtual Machine for Hyper-V virtual devices.
-
Device Type: The type of device, whether it's a server, desktop or mobile device. For example for Windows 10 virtual devices this would be Desktop.
-
Chassis Type: The type of device, whether it's a server, desktop or mobile device. For example for Windows 10 virtual devices this would be Desktop.
-
RAM: The amount of RAM in MB.
-
CPU Type: The CPU Type for the device. For example, Intel(R) Xeon(R) CPU E5620 @ 2.40GHz.
-
CPU Architecture: The architecture for the CPU. For example, x64.
-
SMBIOS GUID: The GUID for the device. For example, 2e4533e6-ea92-4292-8b9c-ebae17edee75.
Operating System
Information on the device's Operating System.
-
Type: Indicates the main type of the OS. For example, Windows or Mac.
-
Version: Shows the colloquial version for the OS. For example, Windows 10 Pro 20H2.
-
Version Number: The version for the Operating System. For example: 10.0.19042.928.
-
Architecture: The architecture of the OS. For example, for 64-bit Windows systems, this would be x64.
-
Installation: The UTC date and time the operating system was installed or updated.
Connectivity and Activity
Connectivity:
-
Status: Whether the device is connected to the Platform or not. This could be Online or Offline.
-
Last Connected: Shows the UTC date and time the device last connected to the Platform.
-
First Connected: Shows the UTC date and time the device first connected to the Platform.
-
Certificate Type: The type of certificate the device is using to connect to the Platform.
-
Certificate Expiry: The UTC date and time the device certificate will expire.
-
Connection State: How the device connects to the Switch.
-
Local IP Address: The local IP address for the connecting device.
-
MAC Address: The MAC address for the client device interface used to connect to the Switch.
-
Connecting IP Address: The IP address for the connecting device.
Activity :
This table provides information on the device's current activity status.
-
Last Boot: The UTC time and date the device was last booted.
-
User: The username for the user most associated with the device.
Env. Variables
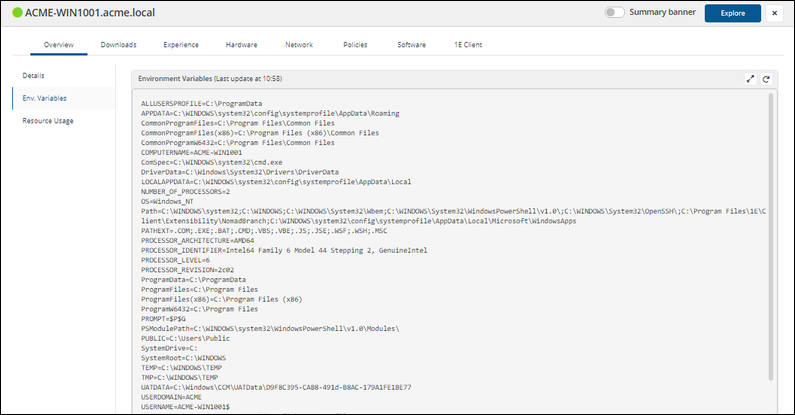
Displays the list of environment variables set on the device. This information is updated each time the page is refreshed.
Resource Usage
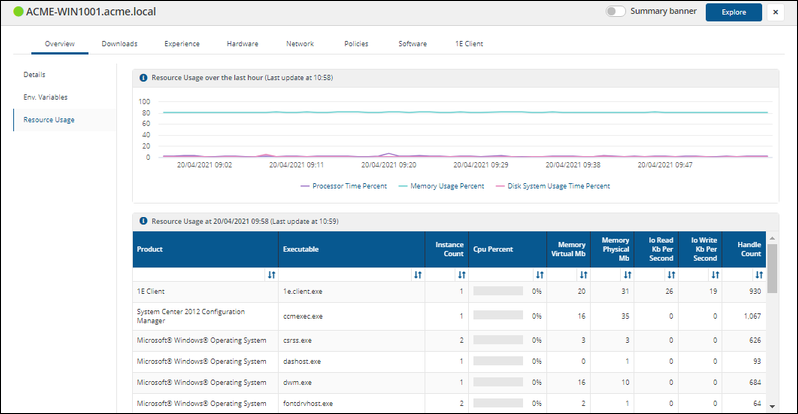
This panel displays the recent resource usage for the device.
-
Resource Usage over the last hour (Last update time):
This tile displays a line graph showing the percentage of resource usage over time during the last hour.
Selecting a point on the graph selects the data displayed in the Resource Usage at date and time tile. This can be useful if there is an outlying data point where you want to investigate the breakdown according to the products on the device.
The three lines displayed show the Processor Time Percent, the Memory Usage Percent and the Disk System Usage Time Percent. You can toggle the display of these lines by clicking on the legend name at the bottom of the graph.
-
Resource Usage at date and time:
This tile displays the product resource usage. Click on a point on the Resource Usage over the last hour tile to show the product resource usage at that particular time. The table shows the following data:
-
Product: Software product name.
-
Executable: Executable name.
-
Instance Count: The number of instances of the product that are running.
-
Cpu Percent: The percentage of CPU used by the product.
-
Memory Virtual Mb: The virtual memory consumed by the product in MB.
-
Memory Physical Mb: The physical memory consumed by the product in MB.
-
Io Read Kb Per Second: The disk I/O read rate per second.
-
Io Write Kb Per Second: The disk I/O write rate per second.
-
Handle Count: The number of resource handles open for the product.
-
Summary banner
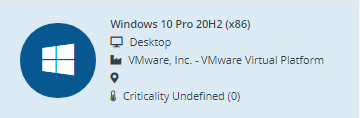
The Summary banner displays a quick summary of the information provided in the various tabs displayed in the Device view. It can be viewed by toggling the Summary banner switch to on.
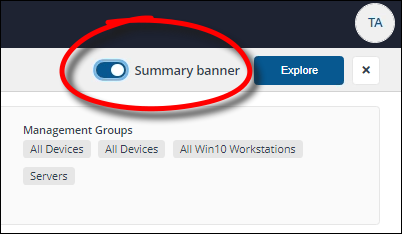
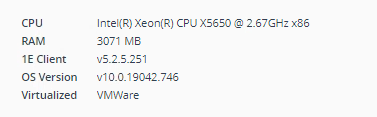
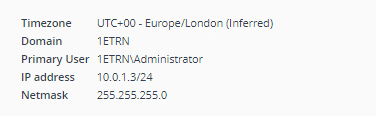
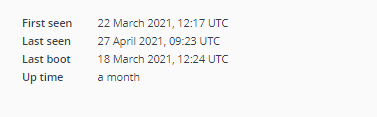
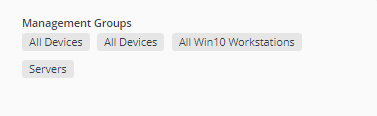
The following image shows the Summary banner displayed for a particular device.

You can click on Explore in the Device view to launch Endpoint Troubleshooting with the current device set as the scope.
Closing the Device view
The Device view is a popup that is displayed when clicking on the name of a device on a page where devices are displayed. To return to the page you came from you need to click the x.
Summary banner panels
The following table describes the information provided in the Summary banner, and shows details equivalent to the following tiles.
|
Panel |
Tab |
Panel |
Column |
Tile |
Description |
Example |
Data source |
|---|---|---|---|---|---|---|---|
|
|
Overview |
Details |
Hardware and Operating System |
Operating System |
Version |
Windows 10 Pro 20H2 (x86) |
Data from 1E Master (the latest online status message) |
|
Hardware and Operating System |
Hardware |
Device Type |
Desktop |
|
|
|
|
|
Hardware and Operating System |
Hardware |
Manufacturer |
VMware, Inc |
|
|
|
|
|
Hardware and Operating System |
Hardware |
Model |
VMWare Virtual Platform |
|
|
|
|
|
Identification |
Location |
Location |
|
|
|
|
|
|
Identification |
Identification |
Criticality |
Undefined (0) |
|
|
|
|
|
|
Overview |
Details |
Hardware and Operating System |
Hardware |
CPU Type |
Intel(R) Xeon(R) CPU X5650 @2.67GHz x86 |
|
|
Hardware and Operating System |
Hardware |
RAM |
3071 MB |
|
|
|
|
|
Identification |
Identification |
1E Client |
v5.2.5.251 |
|
|
|
|
|
Hardware and Operating System |
Operating System |
Version |
v10.0.19042.746 |
|
|
|
|
|
Hardware and Operating System |
Operating System |
Virtual/Physical |
VMWare |
|
|
|
|
|
|
Overview |
Details |
Identification |
Location |
Timezone |
UTC+00 - Europe/London (Inferred) |
|
|
Identification |
Identification |
Domain |
1ETRN |
|
|
|
|
|
Connectivity and Activity |
Activity |
Primary User |
1ETRN\Administrator |
|
|
|
|
|
Connectivity and Activity |
Connectivity |
Local IP Address |
10.0.1.3/24 |
|
|
|
|
|
|
|
|
|
Netmask |
255.255.255.0 |
|
|
|
|
Overview |
Details |
Connectivity and Activity |
Connectivity |
First Connected |
22 March 2021, 12:17 UTC |
|
|
Connectivity and Activity |
Connectivity |
Last Connected |
27 April 2021, 09:23 UTC |
|
|
|
|
|
Connectivity and Activity |
Activity |
Last Boot |
18 March 2021, 12:24 UTC |
|
|
|
|
|
|
|
|
|
Up time |
a month |
|
|
|
|
Overview |
Details |
Identification |
Grouping |
Mgmt. Groups |
|
|
 Device view tabs
In addition to the Overview tab, there are a number of other tabs, each corresponding to an app, feature or data set implemented in the Platform. The Overview and 1E Client tabs are always present in the Device view. Other tabs are visible if an app has been installed and is licensed.
Each tab has one or more panels with tiles populated with data from various sources, some by instructions that are run instantly, with results cached for 3 minutes. An appropriate error message is displayed instead of a tile in the following circumstances:
-
If the device is offline, as indicated by the color of the icon in the top left.
-
The user does not have at least Viewer permission to view use the license the tab or panel.
-
The user does not have questioner permission to run the instruction.
-
An instruction has not been uploaded.
The Device view tabs and panels
Device view tabs and panels lists the names of tabs and their panels, and a description of each tile indicating how the tile is populated.
Overview tab
Details
Displays a number of tiles sorted into Identification, Hardware and Operating System and Connectivity and Activity columns that show information for the selected device retrieved from the online status information.
Env. Variables
Shows a list of the environment variables set on the device.
Resource Usage
Two panels:
-
Resource Usage over the last hour: Shows system disk, CPU and memory usage per minute for the last one hour.
-
Resource Usage at day/month/year time: Shows executable resource usage for a specific minute.
Data source:
Refer to Overview tab.
Downloads tab
Summary
Download activity and status for the device. Whenever you click on an FQDN on any of the Content Distribution pages then the Device view will be displayed with the Downloads tab selected.
Data source: Data from Content Distribution.
Content
Content Titles on the selected device, the default view is from All Sources, All Types and All Status.
Data source: Data from Content Distribution.
You may see a difference in the number of items in a device’s Nomad cache versus that displayed in the Content Distribution app Device view. This is because if downloaded content has been deleted from Configuration Manager, the content titles cannot be resolved in the Content Distribution app and are not displayed. This is under consideration for re-design and may be revised in future versions of Content Distribution.
Content Distribution Configuration
Nomad Branch Settings .
Data source: 1E-Nomad-NomadBranchSettings
Experience tab
Metrics
Metrics are the data points that are collected by the 1E Client and sent to the Platform. They are collected at different intervals depending on the type of data that is being collected.
Data source: Data from Experience metrics.
Trends
The Trends tab shows the changes in the scores over time. Hovering over any of the bars shows the details for that time and event. If the user viewing the device details also has the ability to at least ask a question in Endpoint Troubleshooting the Explore option will be visible.
Data source: Data from Experience metrics.
Logs
The Event Logs tab gives you a listing of the Windows Event log entries for that device. This brings that data to this view and is very useful when determining the root cause of an issue that has been reported on the device.
Data source: Data from Experience metrics.
Application Interactions
Shows user interaction times and ratios across applications measured over the last 30 days.
Data source: 1E-Experience-ApplicationInteraction
User interactions
Shows user interactive sessions with activity over last 30 days.
Data source: 1E-Experience-UserInteractionHistory
Hardware
Disk drives
Shows disk drives, including hardware and usage information.
Data source: 1E-TachyonPlatform-Hardware-DiskDrives
-
Drive: Drive letter.
-
Volume Name: Volume name, if set.
-
Drive Type: Drive type, for example:
-
Removable Disk
-
Local Disk
-
Compact Disk.
-
-
Size Gb: Total disk size in Gb.
-
Free Space Gb: Current free space in Gb.
-
Usage Percent: Percentage used of total drive space.
-
File System: File system, for example NTFS.
-
Manufacturer: Standard or SSD drive.
-
Model: Drive manufacturer.
-
Serial Number: Unique disk serial number.
-
Partition: Drive and partition of the specific drive.
-
Firmware Revision: Drive firmware version.
-
Device ID: Device ID of the specified disk.
Peripherals
Shows the list of plug and play hardware devices (Windows only).
Data source: 1E-TachyonPlatform-Hardware-Devices
-
Device Type: Hardware device, including for example things like:
-
Battery
-
Monitor
-
Keyboard
-
Mouse
-
Ports
-
SoftwareDevice.
-
-
Name: Device name.
-
Instance Count: Number of instances of a peripheral device.
-
Service: Associated Windows service, for example atapi, serial, PCI, ACPI.
Network tab
Throughput
Shows network throughput on all adapters for the last hour, represented by the following tiles:
-
Average throughput: Including Timestamp, Bytes Received per Second, Bytes Sent Per Second.
-
Bytes received per second
-
Bytes sent per second
Data source: 1E-TachyonPlatform-Network-AverageThroughput
Interface configuration
Returns the output from the native network interface configuration command (e.g. ipconfig or ifconfig).
Data source: 1E-TachyonPlatform-Network-InterfaceConfiguration
DNS
Shows the Cache and Host file tiles:
-
DNS Cache Contents - with the entries from local DNS cache, Host Name and Address.
-
HOSTS file - shows the content of the drivers/etc/hosts file.
Data source:
TCP connections
Returns a list of established TCP connections.
Data source:1E-TachyonPlatform-Network-TcpConnections
-
Process Name: Local process name.
-
Process Id: Uniquely identifies an active process.
-
Class: Class of Internet networking protocol.
-
Local Address: Local network address.
-
Local Port: Network port used by a specific process.
-
Remote Address: Source IP address from which the traffic came from.
-
Remote Port: Remote port used by a specific process.
-
Latency Ms: The time taken in milliseconds for data or a request to go from a source to a destination.
Listening ports
Returns a list of processes which are listening for network connections.
Data source: 1E-TachyonPlatform-Network-ListeningPorts
-
Process Name: Local process name.
-
Process Id: Uniquely identifies an active process.
-
Class: Class of Internet networking protocol.
-
Local Address: Local network address.
-
Local Port: Network port used by a specific process.
-
Product: Related product, for example host process for Windows Services, Local Security Authority Process, SCNotification.
ARP Cache
Returns a list of processes which are listening for network connections and also shows routing tables.
Data source:
WIFI
Shows a list of visible wifi networks, including basic network properties.
Data source: 1E-TachyonPlatform-Network-WiFiNetworks
-
SSID: WiFi network name.
-
Is Connected: Shows as either true or false, dependent on whether the corresponding adapter is connected to the network.
-
Is Hidden: Shows as true if the WiFi network is not broadcasting a public SSID.
-
Is Secure: Shows as either true or false:
-
true: If the WiFi network is secure.
-
false: If the network is open.
-
-
Signal: Shows WiFi signal quality; from 0 (worst) to 100 (best).
-
Authentication: The default authentication mechanism supported by the network.
-
BSSI IDs: The Service Set Identifier (SSID) of the network, it will be empty if the network is hidden.
-
Encryption: Shows the default encryption mechanism supported by the network.
-
Adapter: Shows the WiFi network adapter name to which this network is visible.
PatchInsights tab
Patch Status
Patch Insights provides an overview of the last mile patching required on your environment. It is centered around the final stages of your monthly patching process, with a view to allow you to identify the problematic devices in your environment. At this point of its development, Patch Insights does not remediate the cause of patch failures, or the inability to reach devices, but it gives a view of these, and once manual remediation action has been taken, the ability exists within Patch Insights to redeploy the failed patches using the power of the Platform.
-
KB Number: KB number.
-
KB Title: Full title of each KB.
-
last Update: Time KB was last updated.
-
Status: Status of the content.
-
Details: Whether the install was successful.
Policies tab
Rules Compliance
Data source: Data from Endpoint Automation.
-
Rule Name: Name of rules applied to the current device. The viewable list relates to the selected policy from the policy dropdown on the page.
-
State: If the device state is Compliant, Non-compliant or Not Applicable.
-
Type: Rule type:
-
Check: Allows you to verify that a device has a particular state, such as a registry key having a specific value.
-
Fix: Allows you to define a desired state for the device and then enforce that state.
-
-
Effectiveness: Policy rule effectiveness is the usefulness of policy rules and is represented as either:
-
Disabled: The rule has not yet been enabled from the Endpoint Automation Rule Administration page, so it is not currently active.
-
Unassigned: The rule is enabled, but has not been deployed to any devices.
-
Ineffective: The rule has been deployed, but no devices have changed their compliance position for this rule in the last thirty days.
-
Effective: The rule has been deployed and at least one device has changed its compliance position for this rule in the last thirty days.
-
-
History: Rule history.
Diagnostics
Shows the diagnostic information about the policy applied (rules and event subscriptions).
Software tab
Installations
Shows (per-device) installed software.
Data source: 1E-TachyonPlatform-Software-Installations
-
Product: Software product name.
-
Publisher: Software publisher.
-
Version: Product version number.
-
Architecture: Instruction set architecture (ISA) version.
-
Install Date: Software installation date.
Windows services
Shows list of installed Windows services and their current state.
Data source: 1E-TachyonPlatform-Software-Services
-
Name: Windows service name.
-
State: Windows service state, Running or Stopped.
-
Startup Type: Windows service startup type, for example Automatic, Automatic (Delayed Start), Manual, Disabled.
-
Process Id: Uniquely identifies an active process.
-
Description: Windows service description.
-
Logon Account: Windows service logon account context.
-
Type: Windows services type, for example file system driver, kernel driver, shared process.
Env. Variables
Shows operating system environment variables.
Data source: 1E-TachyonPlatform-Software-EnvironmentVariables
Process History
Shows detailed information about all running processes.
Data source: 1E-TachyonPlatform-Software-Processes
-
Product: Software product name.
-
Executable: Executable name.
-
Version: Product version number.
-
Devices count: How many devices are reporting.
-
Crashes: Number of times this software crashed during the last 24-hour reporting period.
-
Hangs: Number of times this software crashed during the last 24-hour reporting period.
Software crash and hang information is obtained from Windows event data. For information on Windows events and the event viewer refer to Windows event viewer
-
Performance anomalies: Number of performance anomalies detected in this software during the last 24-hour reporting period.
-
I/O write KB/s: Average disk I/O read rate per second during the last 24-hour reporting period.
-
I/O write KB/s: Average disk I/O write rate per second during the last 24-hour reporting period.
For background information on analyzing disk storage performance, refer to Analyzing Storage Performance.
-
Virtual Memory Usage KB: Average Virtual Memory Usage KB during the last 24-hour reporting period.
For an explanation of Windows Virtual Memory organization, refer to Physical and Virtual Memory in Windows 10.
-
Processor Time Seconds: Each instance of the executable will burn processor time. This column gives the average of the total time consumed by each process instance per second. Each instance uses the sum of all time used by each core in parallel.
Therefore, it is possible to see more seconds here than in a day (usually 60 x 60 x 24 = 86400) for the whole column, if your system is working extremely hard 24x7. The theoretical maximum would be somewhere near number of cores x seconds per day . Hence, 'Processor Time' rather than 'Human Time'.
-
Processor Time %: This is an easier notion than Processor Time Seconds. This is the average of the processor consumption of each instance. Each instance of this process will have caused different percentages of compute resource in all the processors and cores to be used over time (unless they have specifically requested certain core affinity).
For each minute each process is running, a profile of the usage is built for the whole day. This value is the average of all of those samples. There is no way to work out, for any one of the process instances involved, how long any particular instance was running for. This could indicate a process that is going wild with resources, but it would take more investigation on the device to discover for how long this is happening. It is perfectly possible to see all the values in this column adding up to more than 100% as the processes were not necessarily running at the same time.
For further information on Processor time, refer to Understanding Processor (% Processor Time) and Process (%Processor Time).
-
Responsiveness Impact %: An indicator of how reactive a process is to activity by other processes on the device. Typically, anti-virus products watch and respond to potentially suspicious activity such as increased network traffic. Anti-virus products will differ in their impact on the overall performance of a device.
Responsiveness Impact % represents the proportion of the increased CPU activity detected by the 1E Client as a result of performing a set of operating system-level operations that can be attributed to a given running process. Examples of these would be Windows registry and resource creation operations.
It is reported as a percentage to normalize results across devices that offer a range of computing power.
For example, if software.exe on a device is attributed a Responsiveness Impact of 53% this means that more than half of the spike in CPU usage caused by software monitoring activity on that device can be attributed to software.
Responsiveness Impact % is used to indicate how sensitive a process appears to be to the use of system resources by other processes on a device. For example, Security Protection software present on a device may reveal a spike in its activity whenever a new process is started on that device.
This would typically be because the Security Protection software may wish to ensure that the new process starting on the device is present in a security white list. Other software may also react to activity by other processes and by reacting they impact system resource uses, thereby adversely affecting the user's experience. So it is useful to be able to identify software with the highest Responsiveness Impact on a device and potentially investigate further.
-
Handle Count: Average number of Windows handles used by this software during the last 24-hour reporting period.
For further information on Windows handles refer to Handles and objects.
For tips on examining open handles for any Windows process, refer to Handle v5.0.
-
Physical Memory Usage KB: Average Physical Memory Usage KB during the last 24-hour reporting period.
Refer to RAMMap v1.63 for a useful tool to examine physical memory allocation on a device.
VDX tab
-
Details: VDX session details.
-
User Sessions: VDX user sessions.
1E Client tab
Binaries
Shows a list of the binary files in the executable folder of the 1E Client.
Data source: 1E-TachyonPlatform-Client-Binaries
-
File Name: Associated 1E Client file name.
-
File Version: Software version.
-
File Size: File size in bytes.
-
Description: File description.
-
Date Created: The date the file was written to disk.
-
Date Modified: The date the file was last saved.
Configuration file
Shows the full content of the 1E Client configuration file, including:
-
Logging settings.
-
Communication settings.
-
Agent settings.
-
Module settings.
Data source: 1E-TachyonPlatform-Client-ConfigFileContent
Extensibility
Shows extensibility objects (modules and providers) loaded by the 1E Client.
Data source: 1E-TachyonPlatform-Client-Extensibility
-
Type: Module or Provider component.
-
Binary Name: Associated 1E Client binary name, for example 1E.Client.Module.Interaction.dll
-
Name: Name, for example Interaction.
-
Version: 1E Client version.
Local Storage
Shows Data Files and Client Inventory Database Use tiles that display the list of:
-
Data files (logs, databases, etc) created by the 1E Client.
-
Tables in the1E Client Inventory database, along with a row count per table.
Data source: