Saved reports
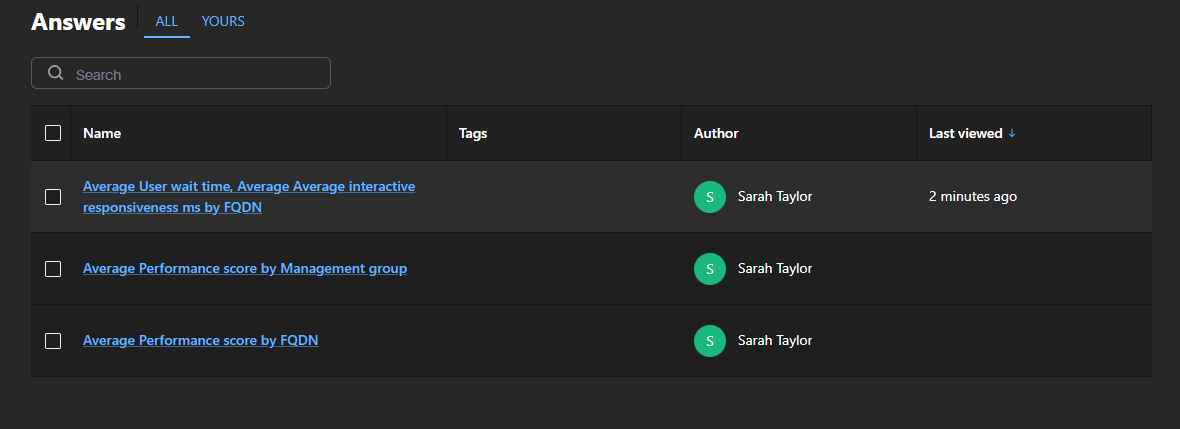
The Answers page displays answers saved from the Reporting page. You can filter the list to show answers you have saved or those made discoverable by others.
Use the fully featured report builder to modify visualizations, adjust aggregations, change chart types, add filters, reorganize groupings, or fine-tune calculations for deeper analysis.
Saving a report
This example demonstrates how to identify and analyze devices with persistent user responsiveness issues.
-
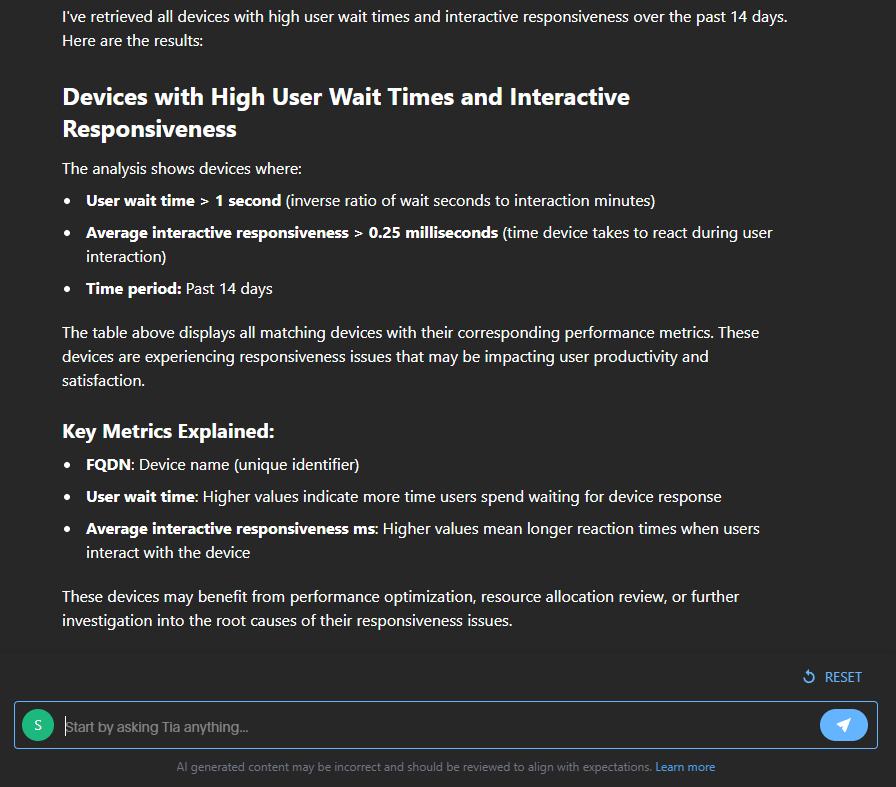
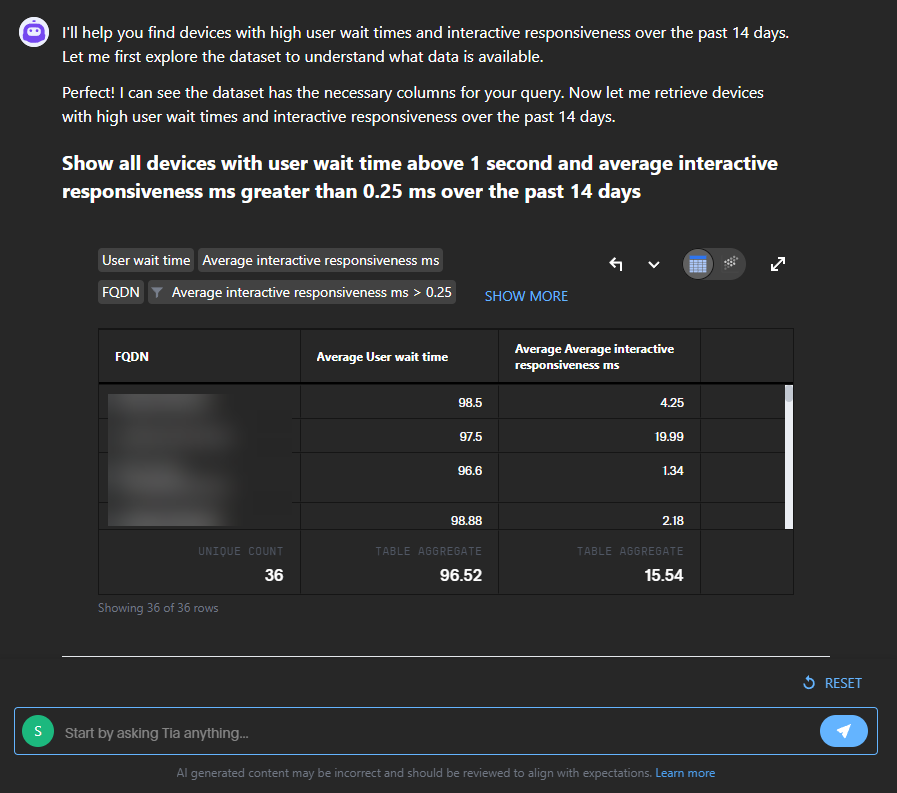
From the Reporting page we ran the query:
"Show me all devices with high user wait times above 1 second and interactive responsiveness greater than 0.25 ms over the past 14 days."
-
Click Save to save the report to Saved Reports. You can also click Edit to immediately customize the results before you save them.
-
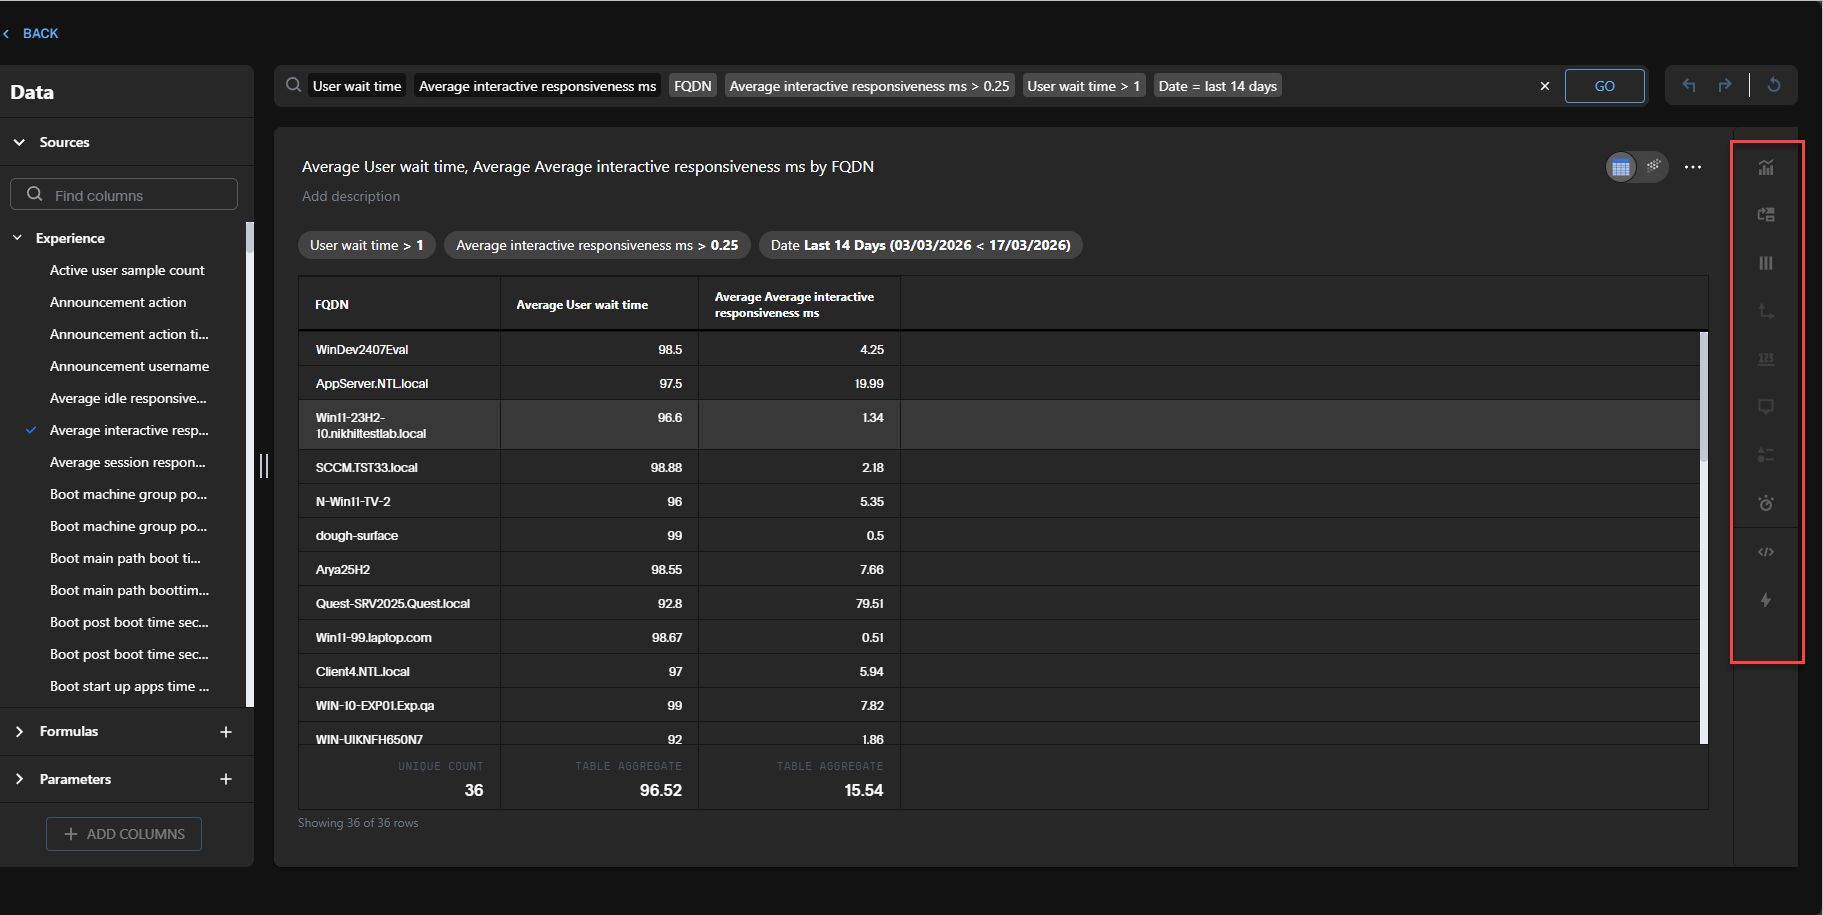
From Saved Reports, Clicking Average User wait time, Average Average interactive responsiveness ms by FQDN opens the report from our list of answers.
Observability offers a variety of chart types, each providing a different way to visualize your data. Select a different chart or visualization type from the right-hand navigation.
To switch between tables and charts, toggle between View Table or View Chart. Clicking the three dots gives you the options to save, download, or delete your chart.
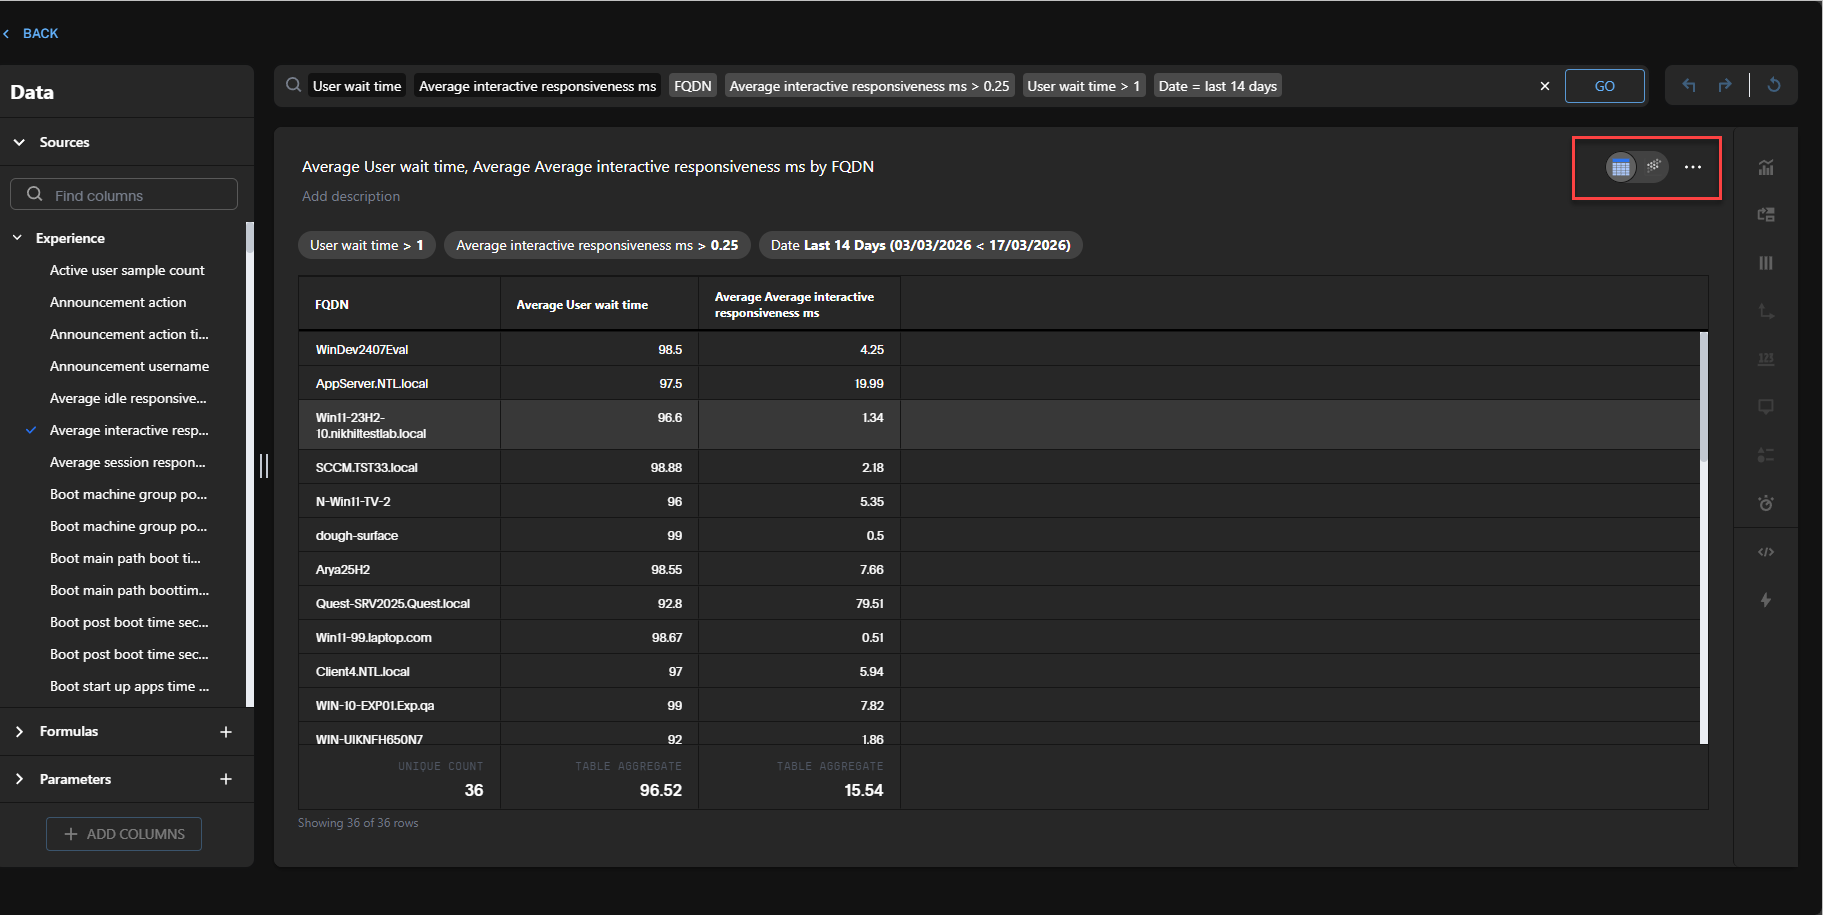
Currently available options are:
-
Type: Select the icon to view the chart catalog.
-
Layout: Adjusts visible columns.
-
Column: Adjusts column display, giving you the option to include conditional formatting.
-
Axis: Controls the X and Y axis for a chart.
-
Data label: Adds your choice of data point labels.
-
Tooltip: Controls chart tooltips.
-
Legend: Amends what each visual element represents.
-
Display: Edits items like Max data points, and chart background.
-
Query details: Shows the computed measures for each query attribute.
-
Custom actions: Adds a custom action to your chart.
Data
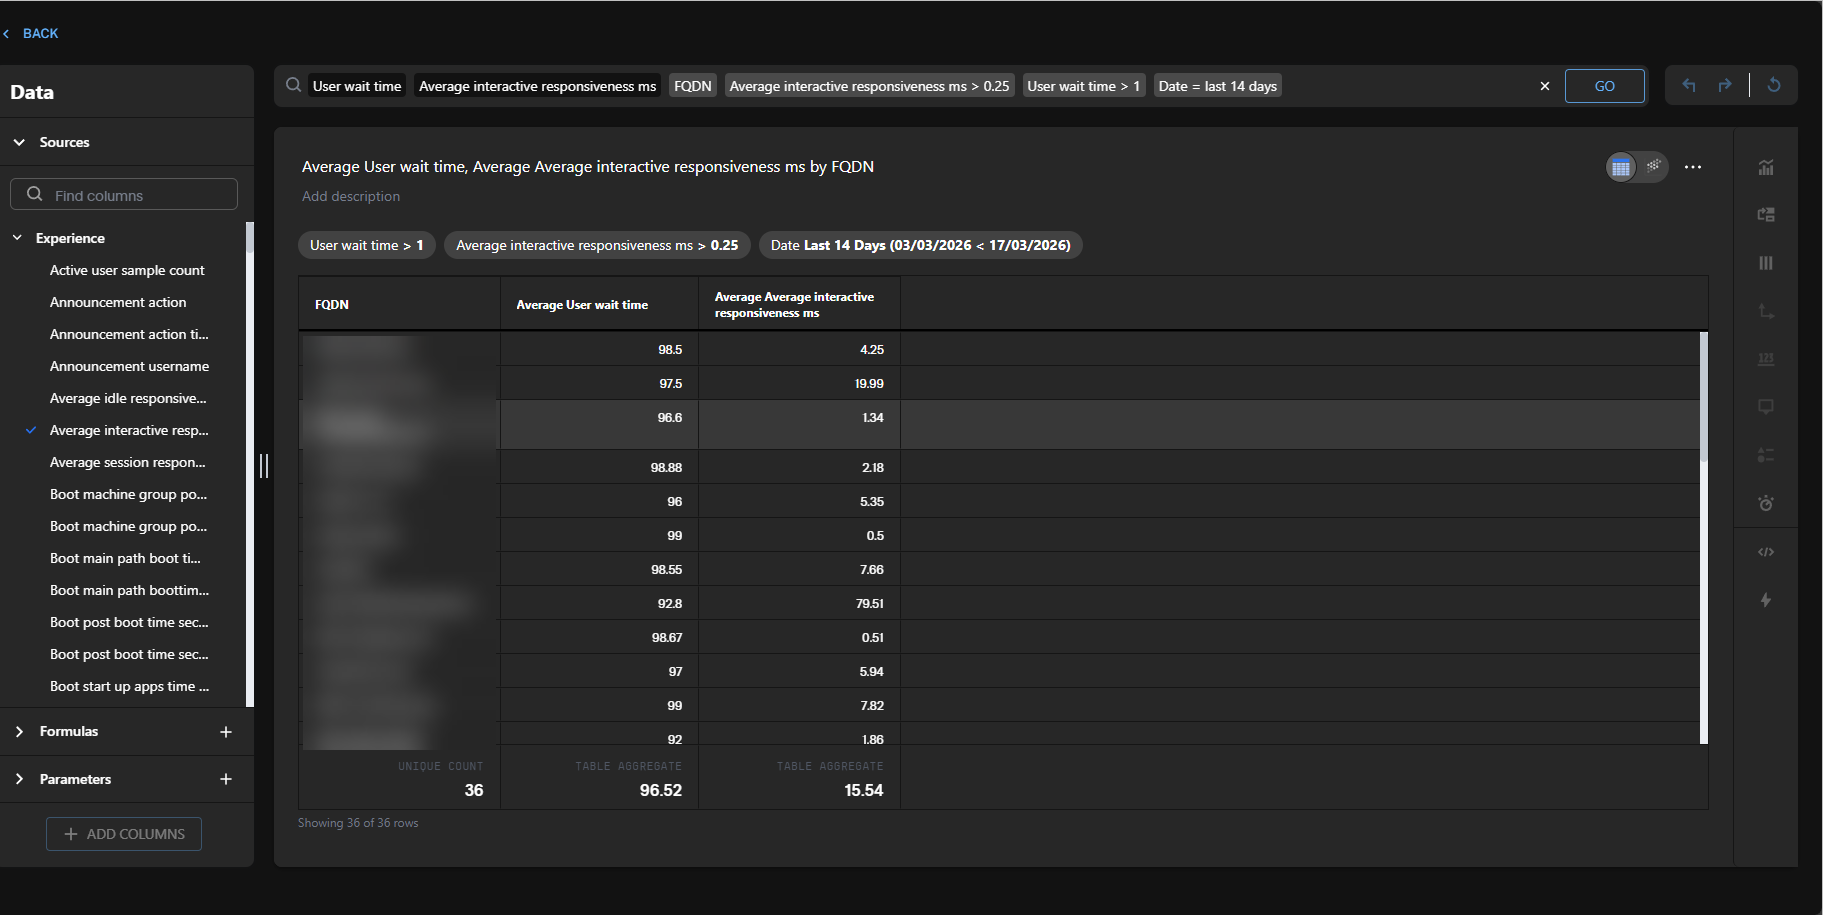
This section lets you filter your data source (Currently Experience Analytics). You can also create formulas and parameters for that data.
Experience data
From the 26.3 release, Observability uses the Experience data model as the basis for its reports, so all reports are based on Experience data. For more information, refer to Experience Analytics.
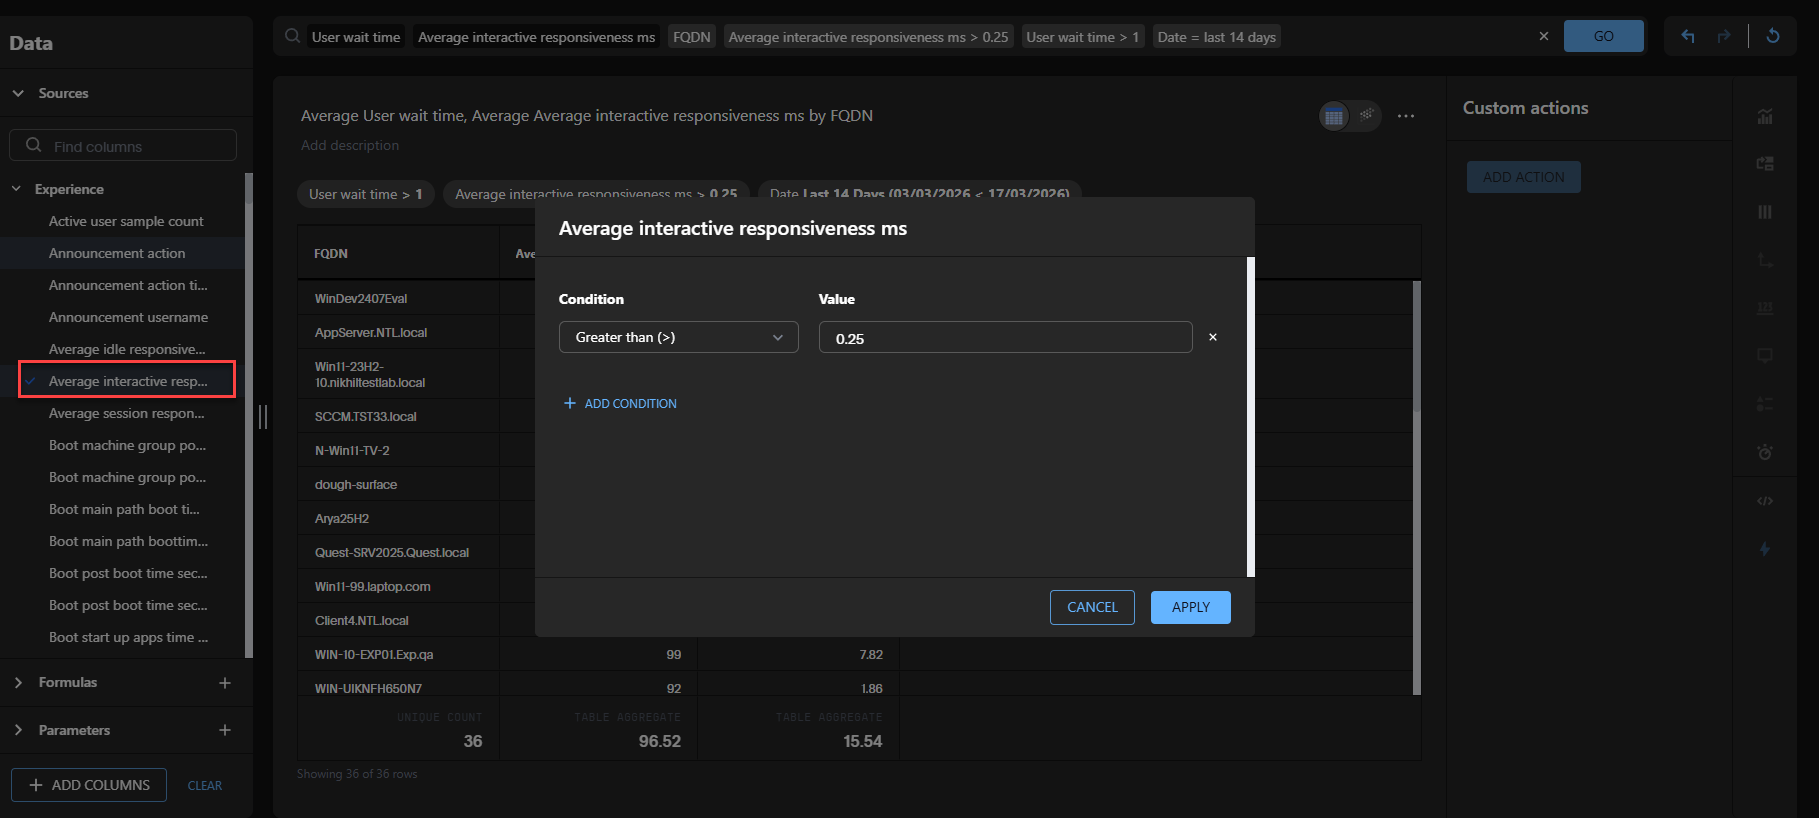
A blue check mark indicates that a metric is used as a data source for your report. In the example below Average interactive responsiveness ms was used in the original query that built the report:
"Show me all devices with high user wait times above 1 second and interactive responsiveness greater than 0.25 ms over the past 14 days."
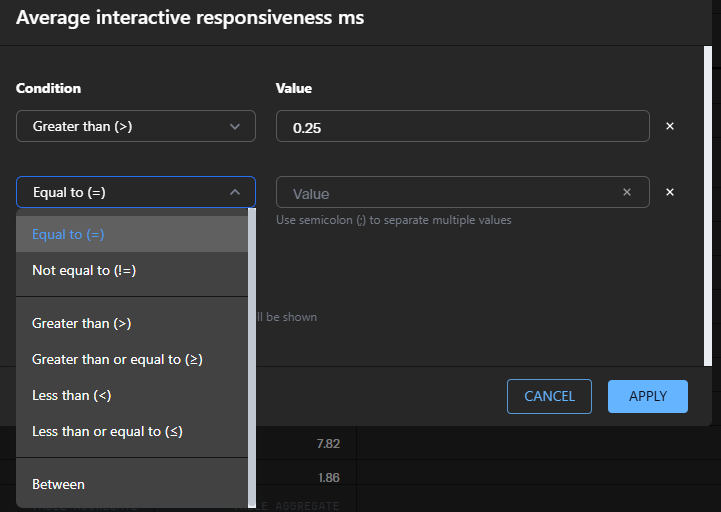
You can modify this metric by adding conditions using the following Boolean operators.
Formulas
To provide richer insights, you can add a formula. The Formula Editor supports various operators, including logical (if, then, else), math, date, and text functions.
Creating a formula
-
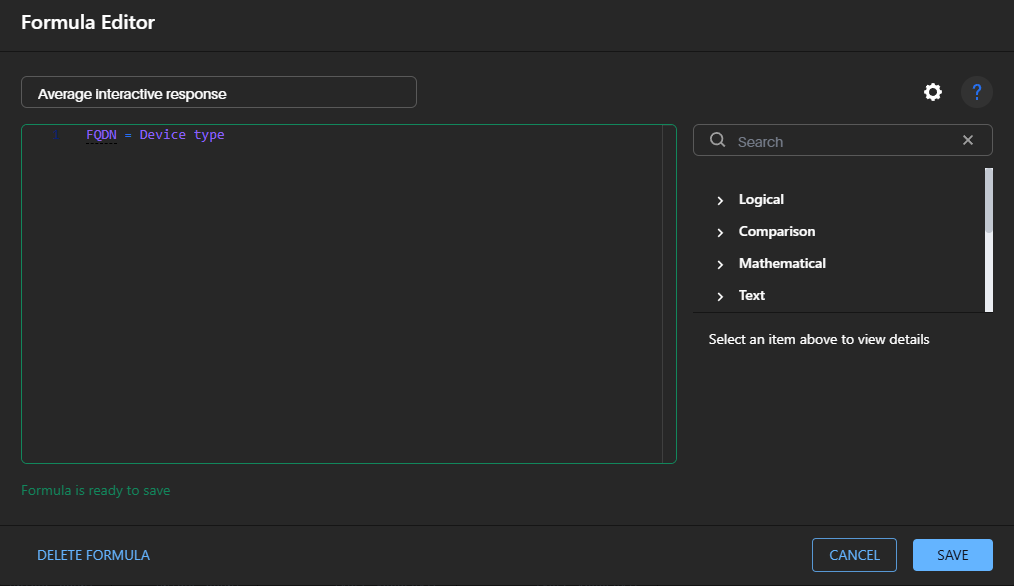
Open the Formula Editor and enter a name. To continue the formula on a new line, press Enter. As you type, the editor displays suggestions after entering at least one character.
Formula elements are color coded:
-
Blue: Operators and functions.
-
Purple: Column names.
-
Green: Parameter names.
-
Black: Constants.
-
-
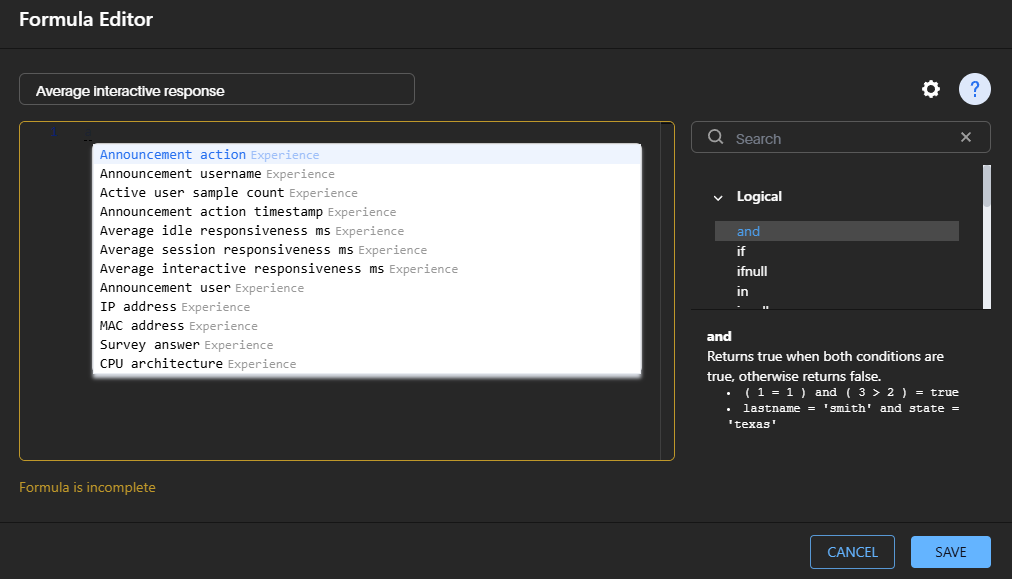
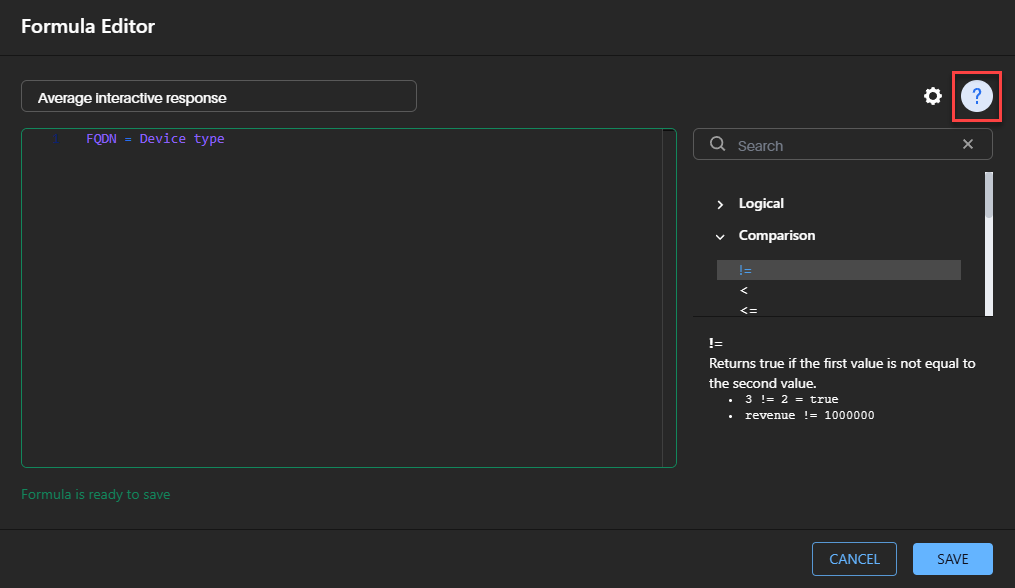
To view a list of formula operators with examples, select the help icon in the upper-right corner.
-
Use Search to find a specific operator.
-
Expand a category, such as Comparison, and select an operator to see its definition and example.
-
When you are finished, select Save. If your formula does not already have a name, enter one.
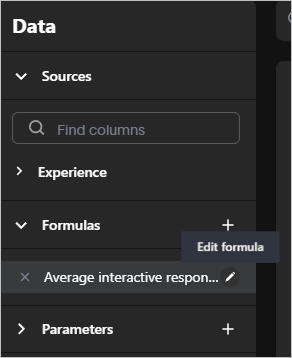
Editing a formula
You can view, edit or delete a formula that was added to a search. To do this select the edit icon next to the formula name in the list, then view or modify the formula in the Formula Editor.
Parameters
In Observability a parameter is a container or a placeholder such as a number, date, or string that can replace a constant value or a list of values.
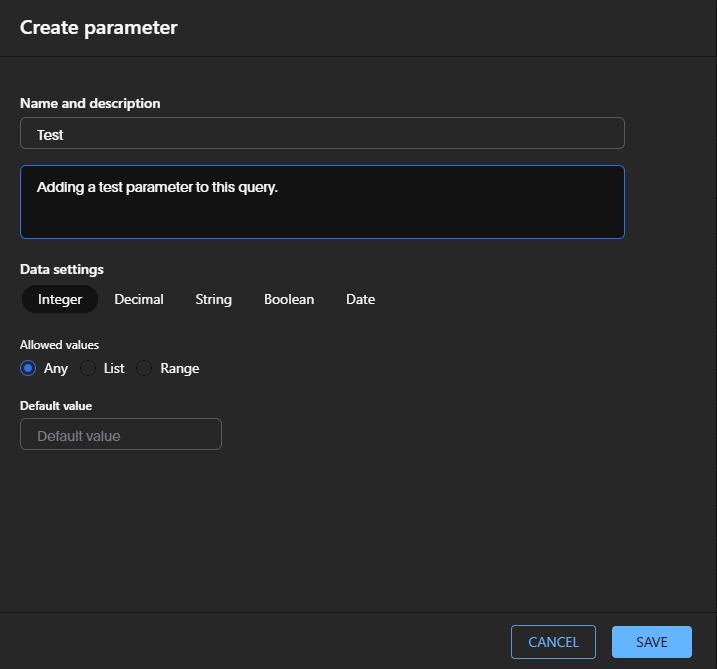
Creating a parameter
-
In the parameter name field, enter a unique name for your parameter.
Optionally, in Add a description provide additional information users might need before using this parameter. It is a best practice to note which formulas the parameter is used in, along with any other relevant details.
-
Under Data settings, select the parameter data type: Integer, Decimal, String, Boolean, or Date.
-
For Integer, Decimal, or Date types, specify the allowed values:
-
Any: Allows any value within the data type’s constraints.
-
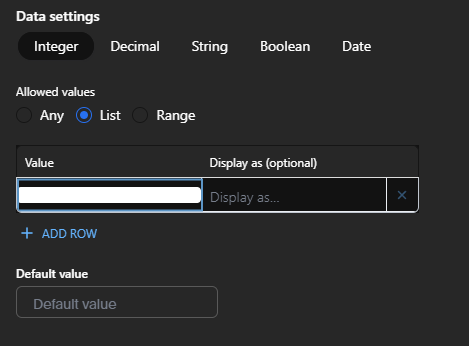
List: Accepts only values you define. Enter a value in Enter value, optionally set a display name in the Display as and use Add row to add more values. Delete a value, by selecting the X next to it.
-
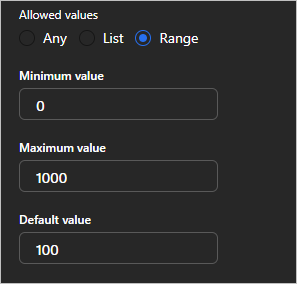
Range: Accepts only values within a specified range. Enter the start and end values in Minimum value and Maximum value.
-
-
For the Boolean type, optionally set custom names for true and false; for example, 0 and 1.
-
Set a Default Value for the parameter. For the Boolean types, use the dropdown menu. For other types, enter the default value in Default value.
-
Select Save.
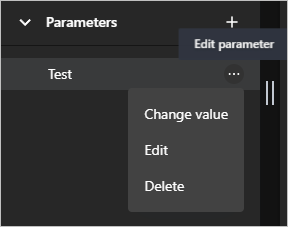
Editing a parameter
You can view, edit or delete a parameter added to a search. To do this, select the three dots next the parameter name, then choose to change its value, edit or delete the parameter.
Example report
Finding answers in digital employee experience data can be time-consuming, but natural language querying lets you ask a question and get a structured answer in seconds. This video shows how to create an example report.