Home page, questions, and responses
Explore the Endpoint Troubleshooting home page. Learn how to frame queries, run instructions, and view real-time responses and instruction history to investigate connected devices.
Using the new UI
We are currently migrating existing functionality to the new UI. While workflows and naming conventions may change, the underlying use cases will remain the same.
The new UI uses modern design principles and includes the following elements:
-
Expandable left-hand and drop-down menu: The menu can be expanded or collapsed using the chevron icon located at the top of the pane.
-
Search: Execute instructions and search for devices using keyboard shortcuts, including those based on their Fully Qualified Domain Name (FQDN) and Insights.
-
DEX Intelligence: A powerful tool designed to enhance your organization's efficiency and decision-making capabilities.
-
Inventory Insights: Devices and Software are available in the left-hand navigation bar.
-
Investigation: Search, run, schedule, review, and manage device instructions directly from the console, including access to instruction history and scheduled tasks.
-
Observability: Ask questions in natural language and instantly generate and customize reports based on your organization’s data.
-
User Engagements: Create user engagements, surveys, and announcements in an appropriate language.
-
Settings: You can access and configure 1E Client certificates, integrations, Identity Provider certificates and Platform settings.
-
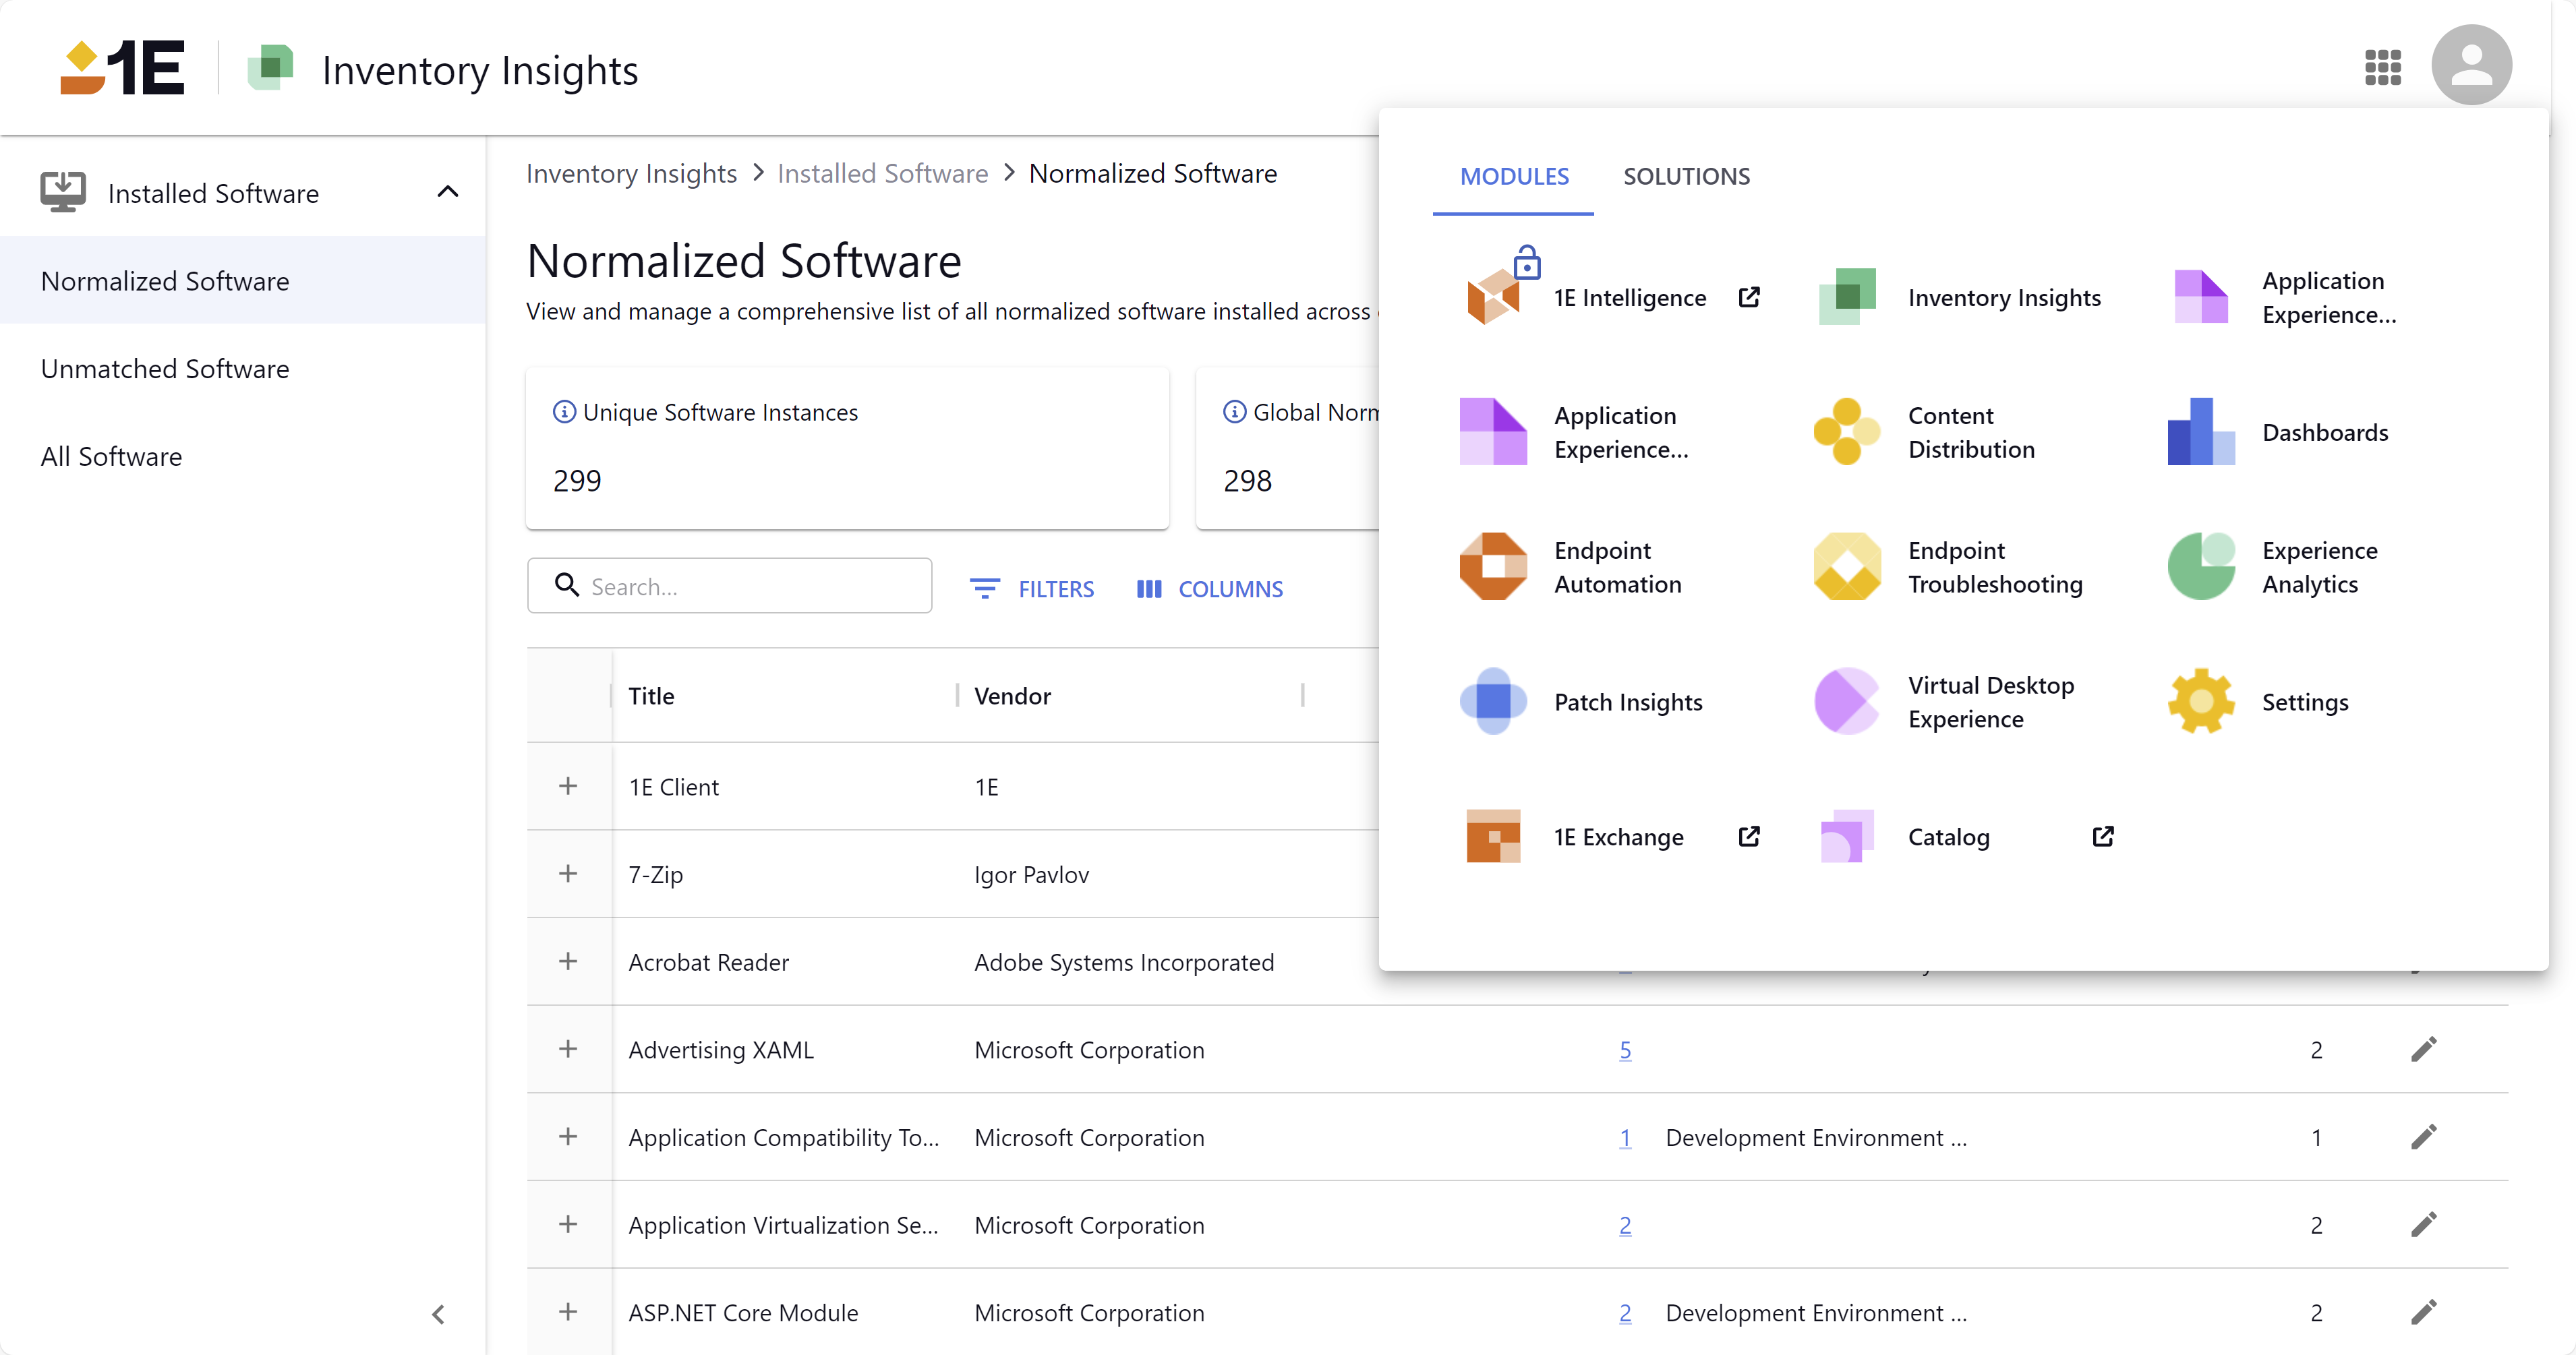
Module launcher: You can launch other Platform modules and any Solutions that are included with your license.
-
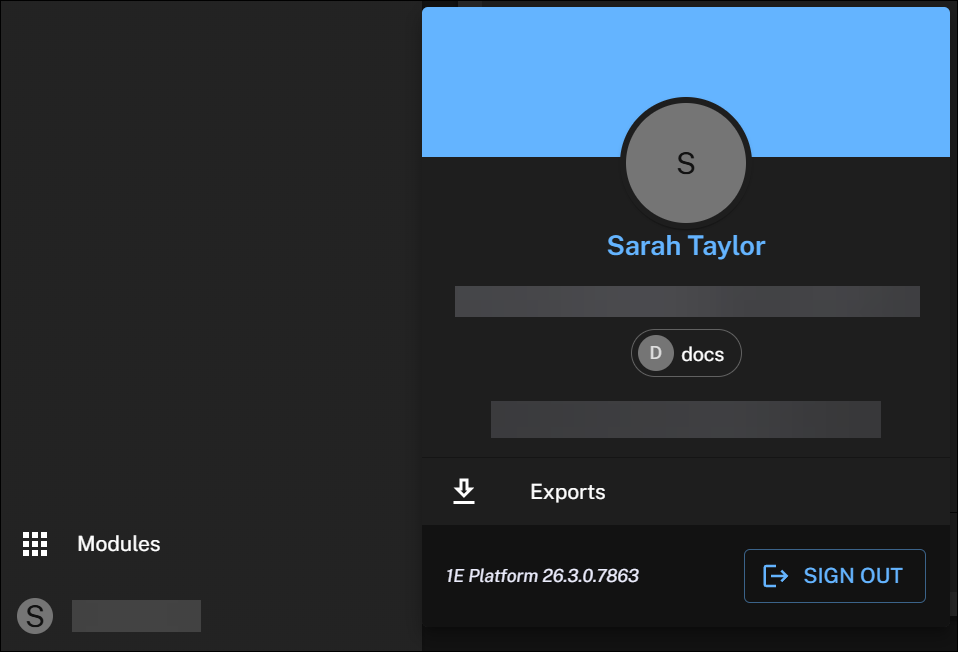
User profile: Click this to manage your exports, check your Platform version, or log out.
Dark mode is only available in the new UI. You can control the system theme using the switcher in Settings. For details refer to Appearance.
Module visibility is determined by your license.
Investigation
You can run Instructions and view instruction history from Investigation, Inventory Insights, DEX Intelligence, and Search.
The ability to run instructions is controlled by Role-Based Access Control (RBAC). For more information refer to Permissions.
As part of the TeamViewer DEX platform modernization, the new UI provides an Investigation area. You can now search for, run, or schedule device instructions directly from the console, review a chronological history of previously sent instructions, and view or manage instructions scheduled for future execution.
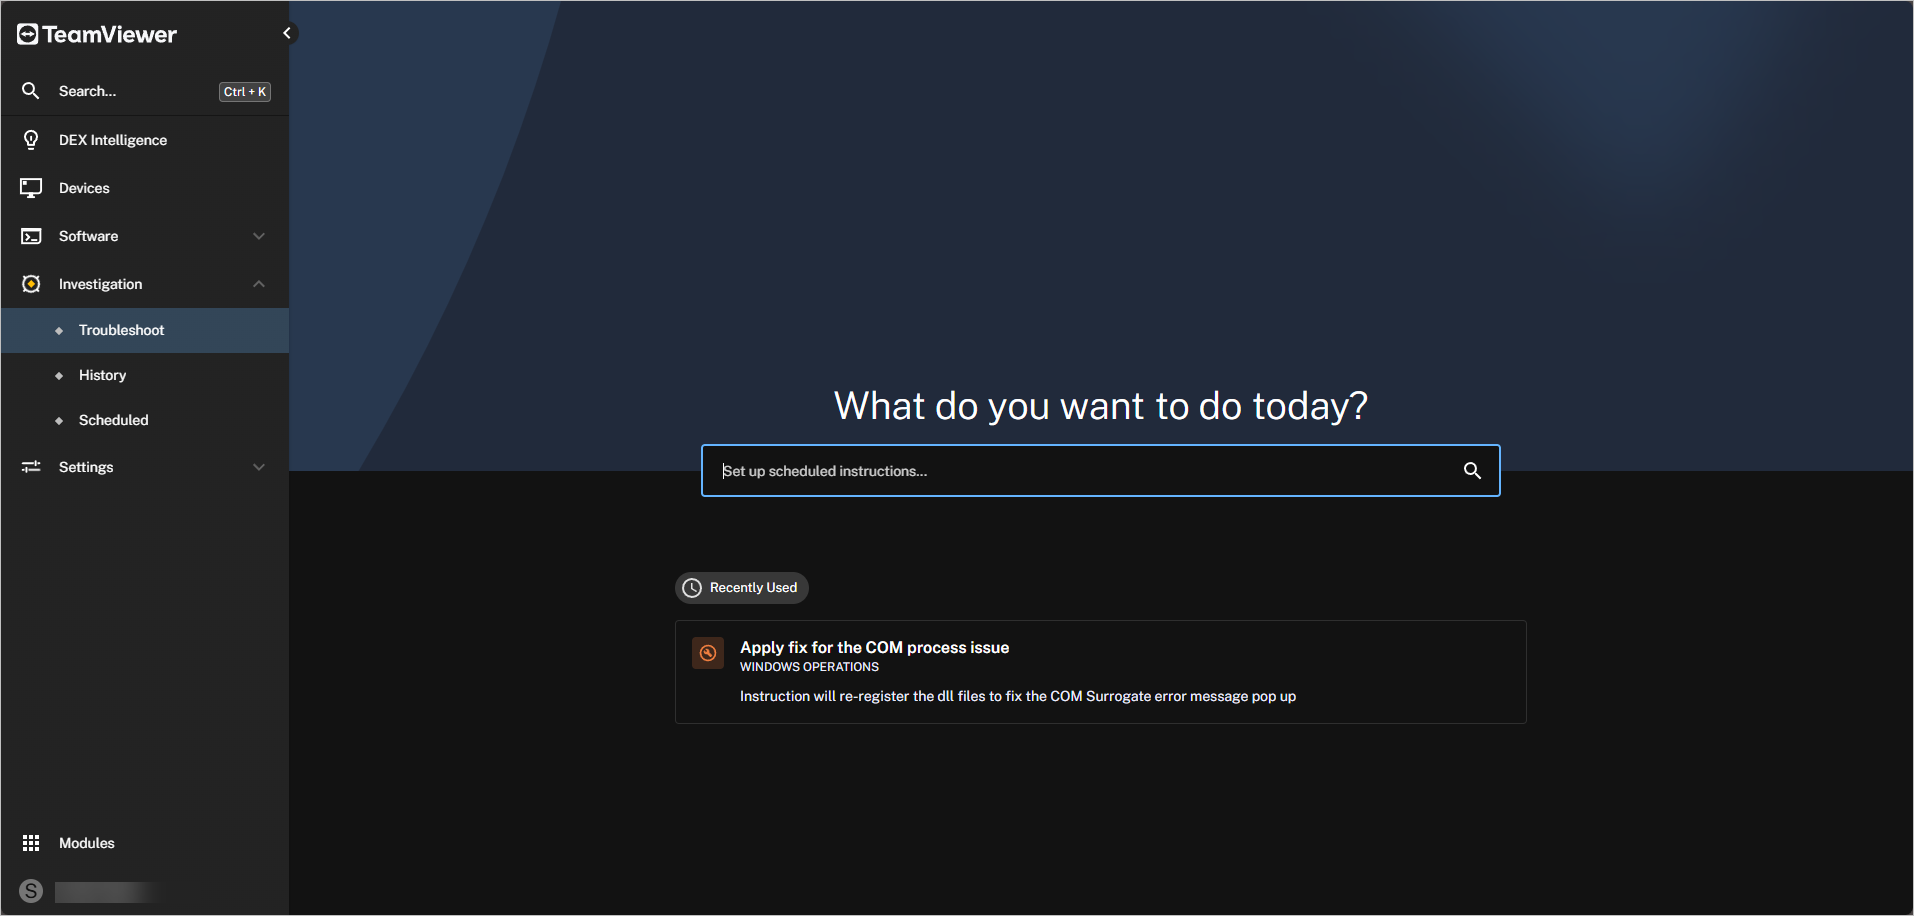
Troubleshoot
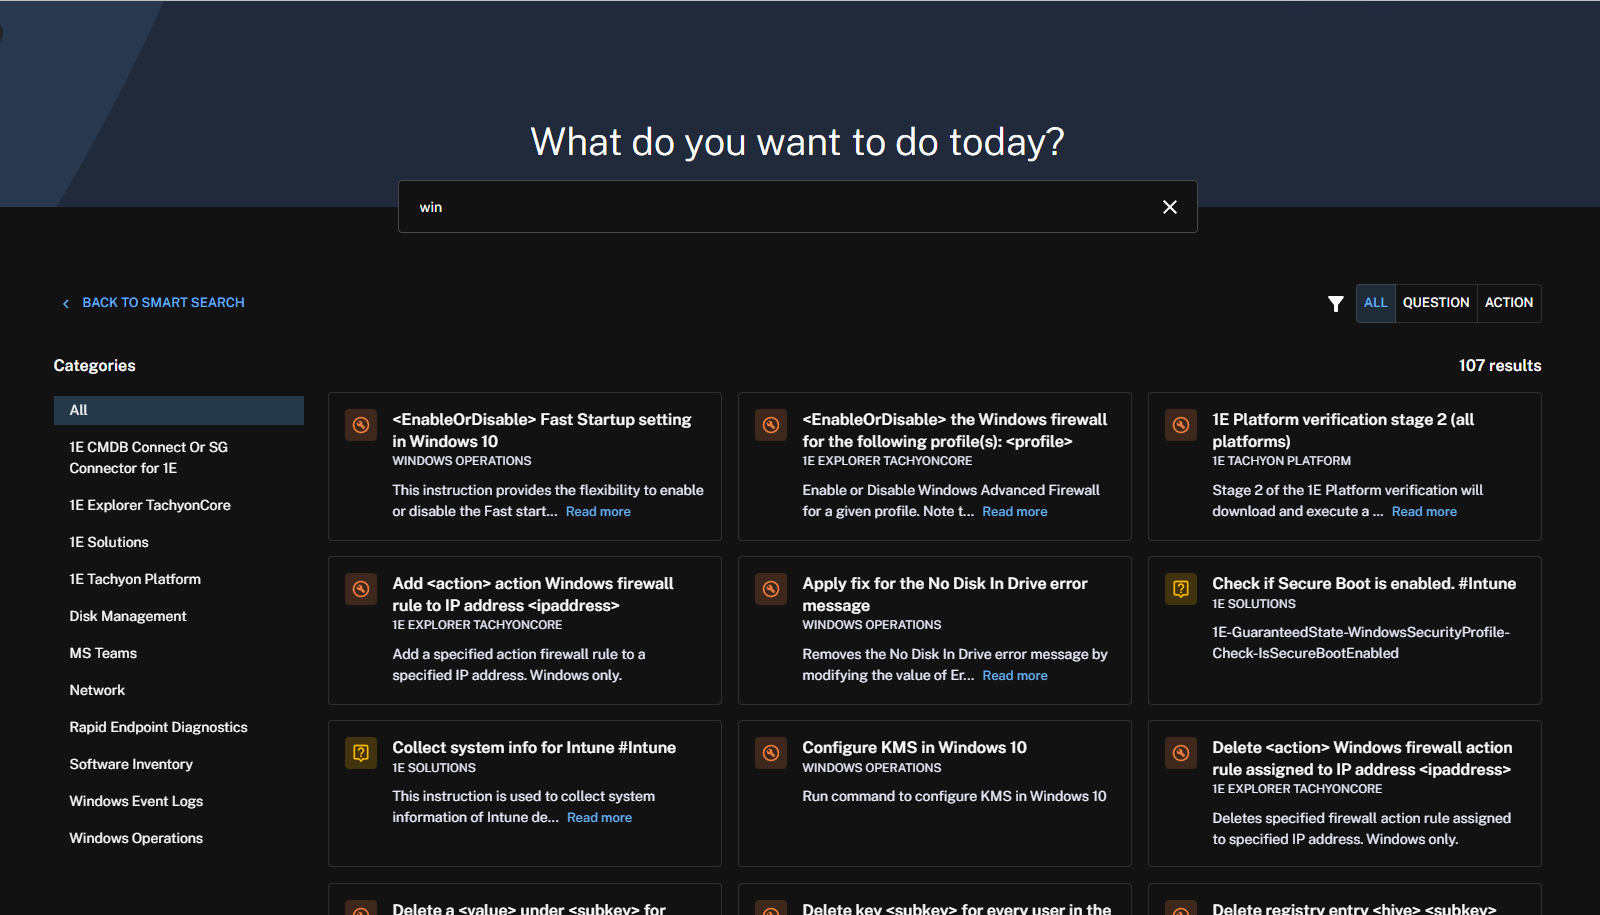
You can run instructions directly from the Troubleshoot page, which shows your recently used instructions.
-
Dynamic search returns results from both questions and actions. For example, typing win in the search box returns four results. You can filter the results by question or action.
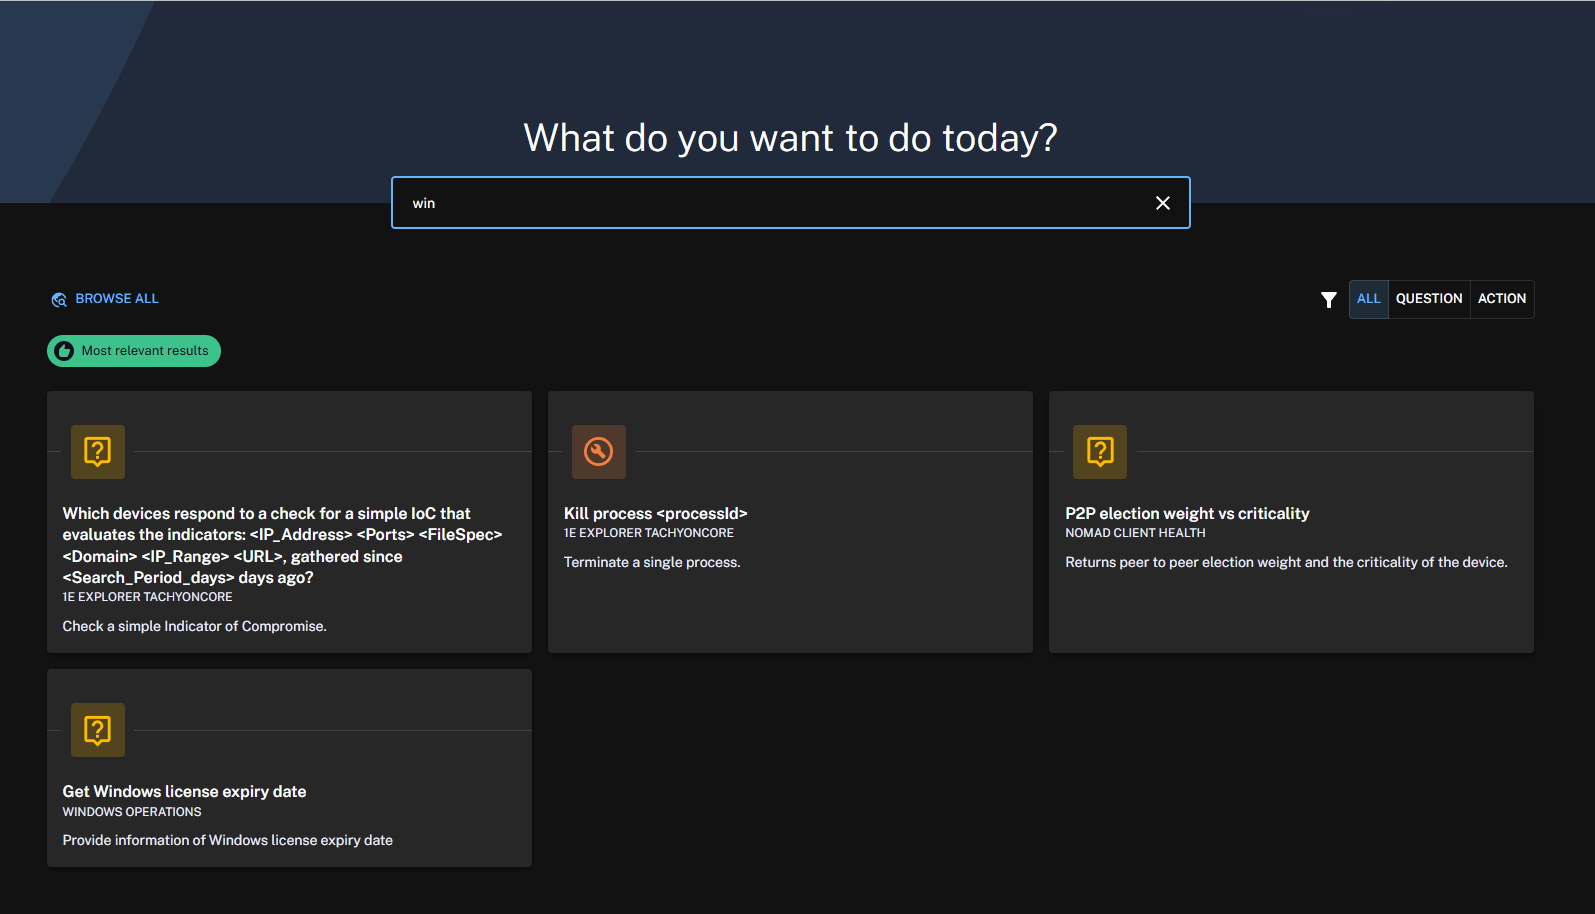
Alternatively, you can browse all instructions available to you in the Platform by category.
-
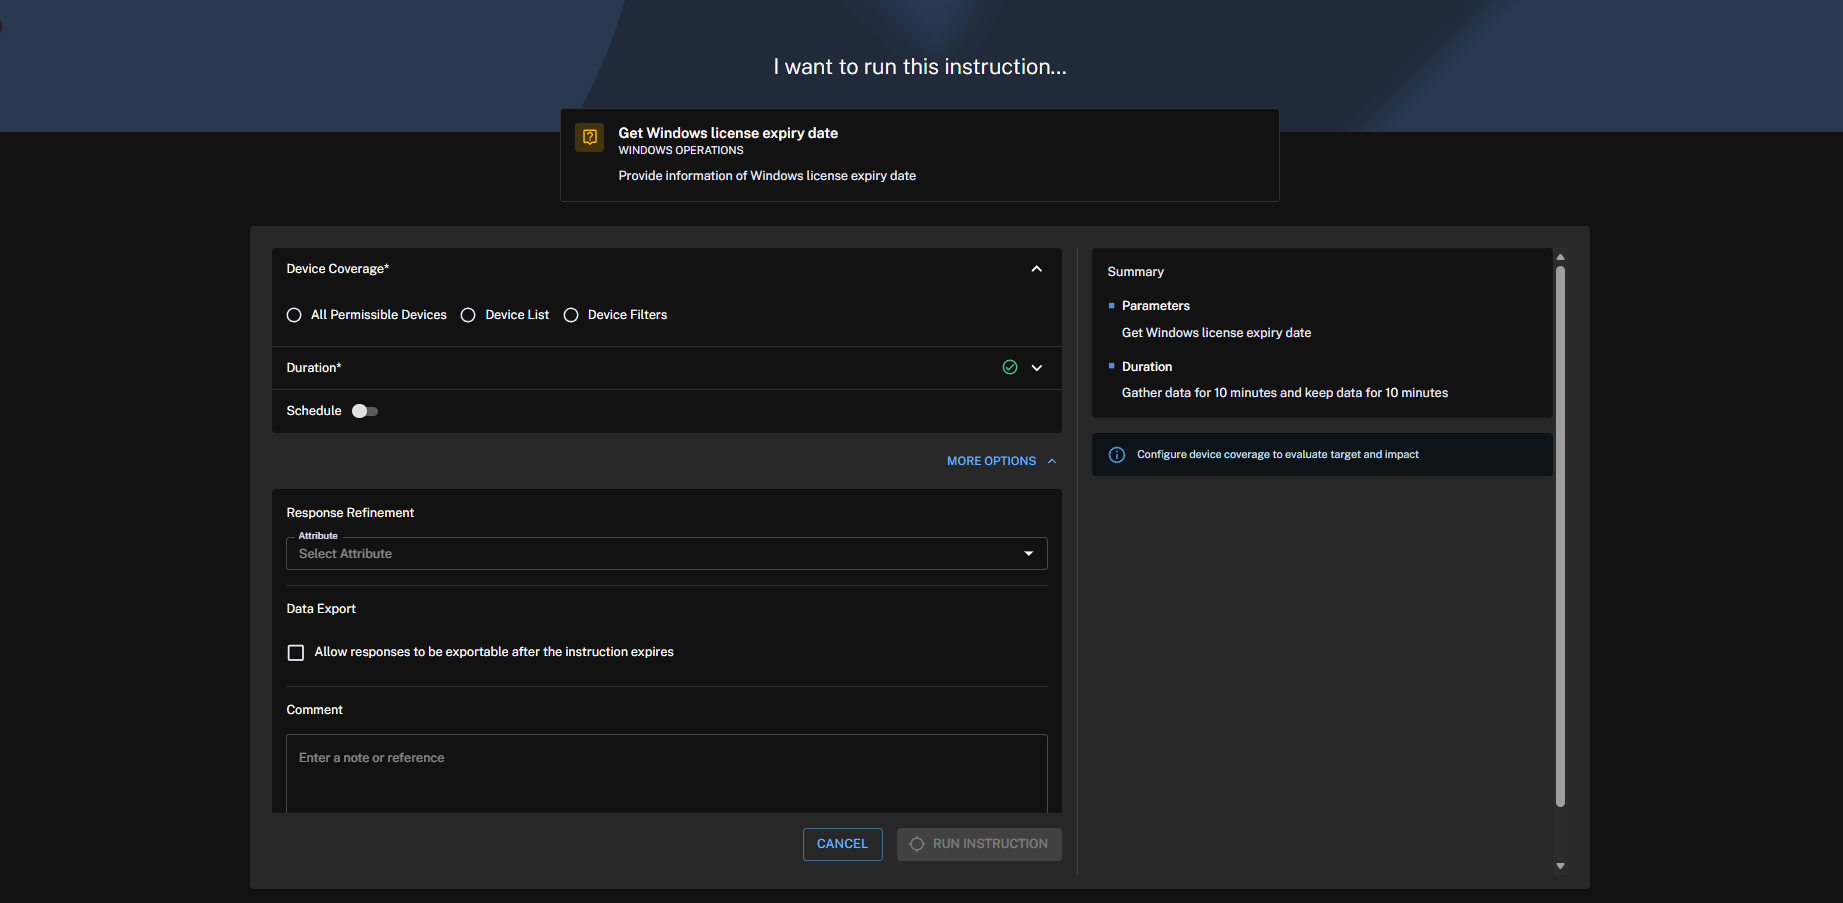
Select Get Windows license expiry date from the instruction results to open the I want to run this instruction page.
This page provides advanced configuration options for Device coverage, Duration, and Schedule, as well as additional options for Response refinement and Data export.
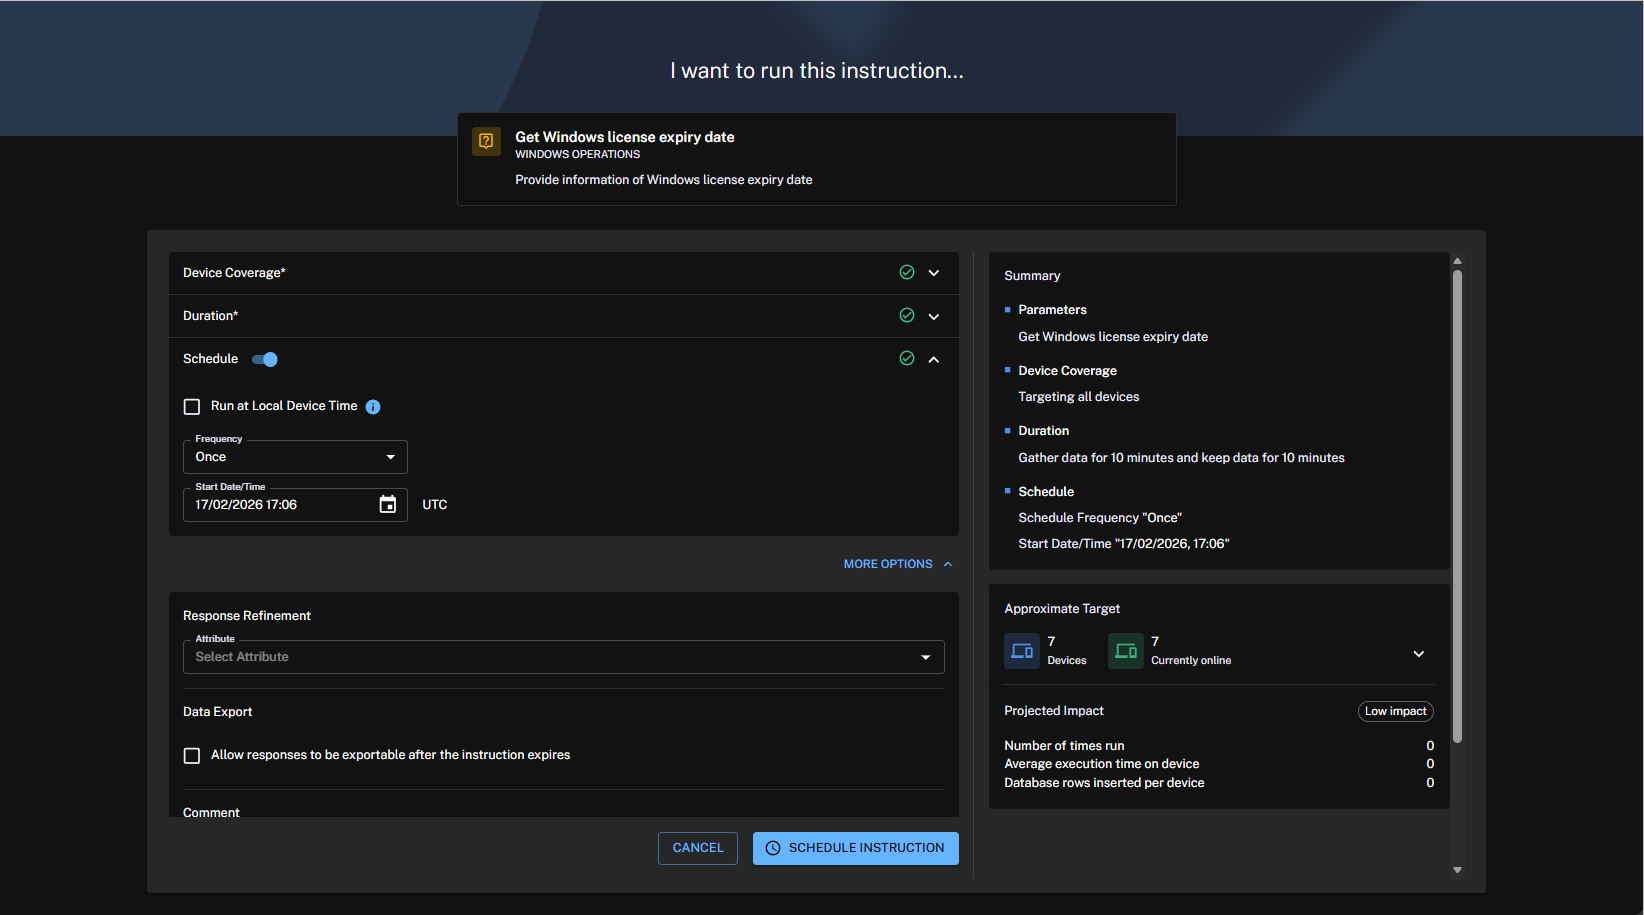
You can schedule instructions by setting options such as Frequency, Start date and time, and whether to Run at local device time. All scheduled instructions appear on the Scheduled page, accessible from the left-hand navigation bar.
You can also view the Approximate target devices with an expandable Device breakdown by device type and operating system, as well as the Projected impact.
-
After setting your question parameters, click Run Instruction to open the instruction detail page, where you can track its progress. You can see the response status and the response details in the grid below.
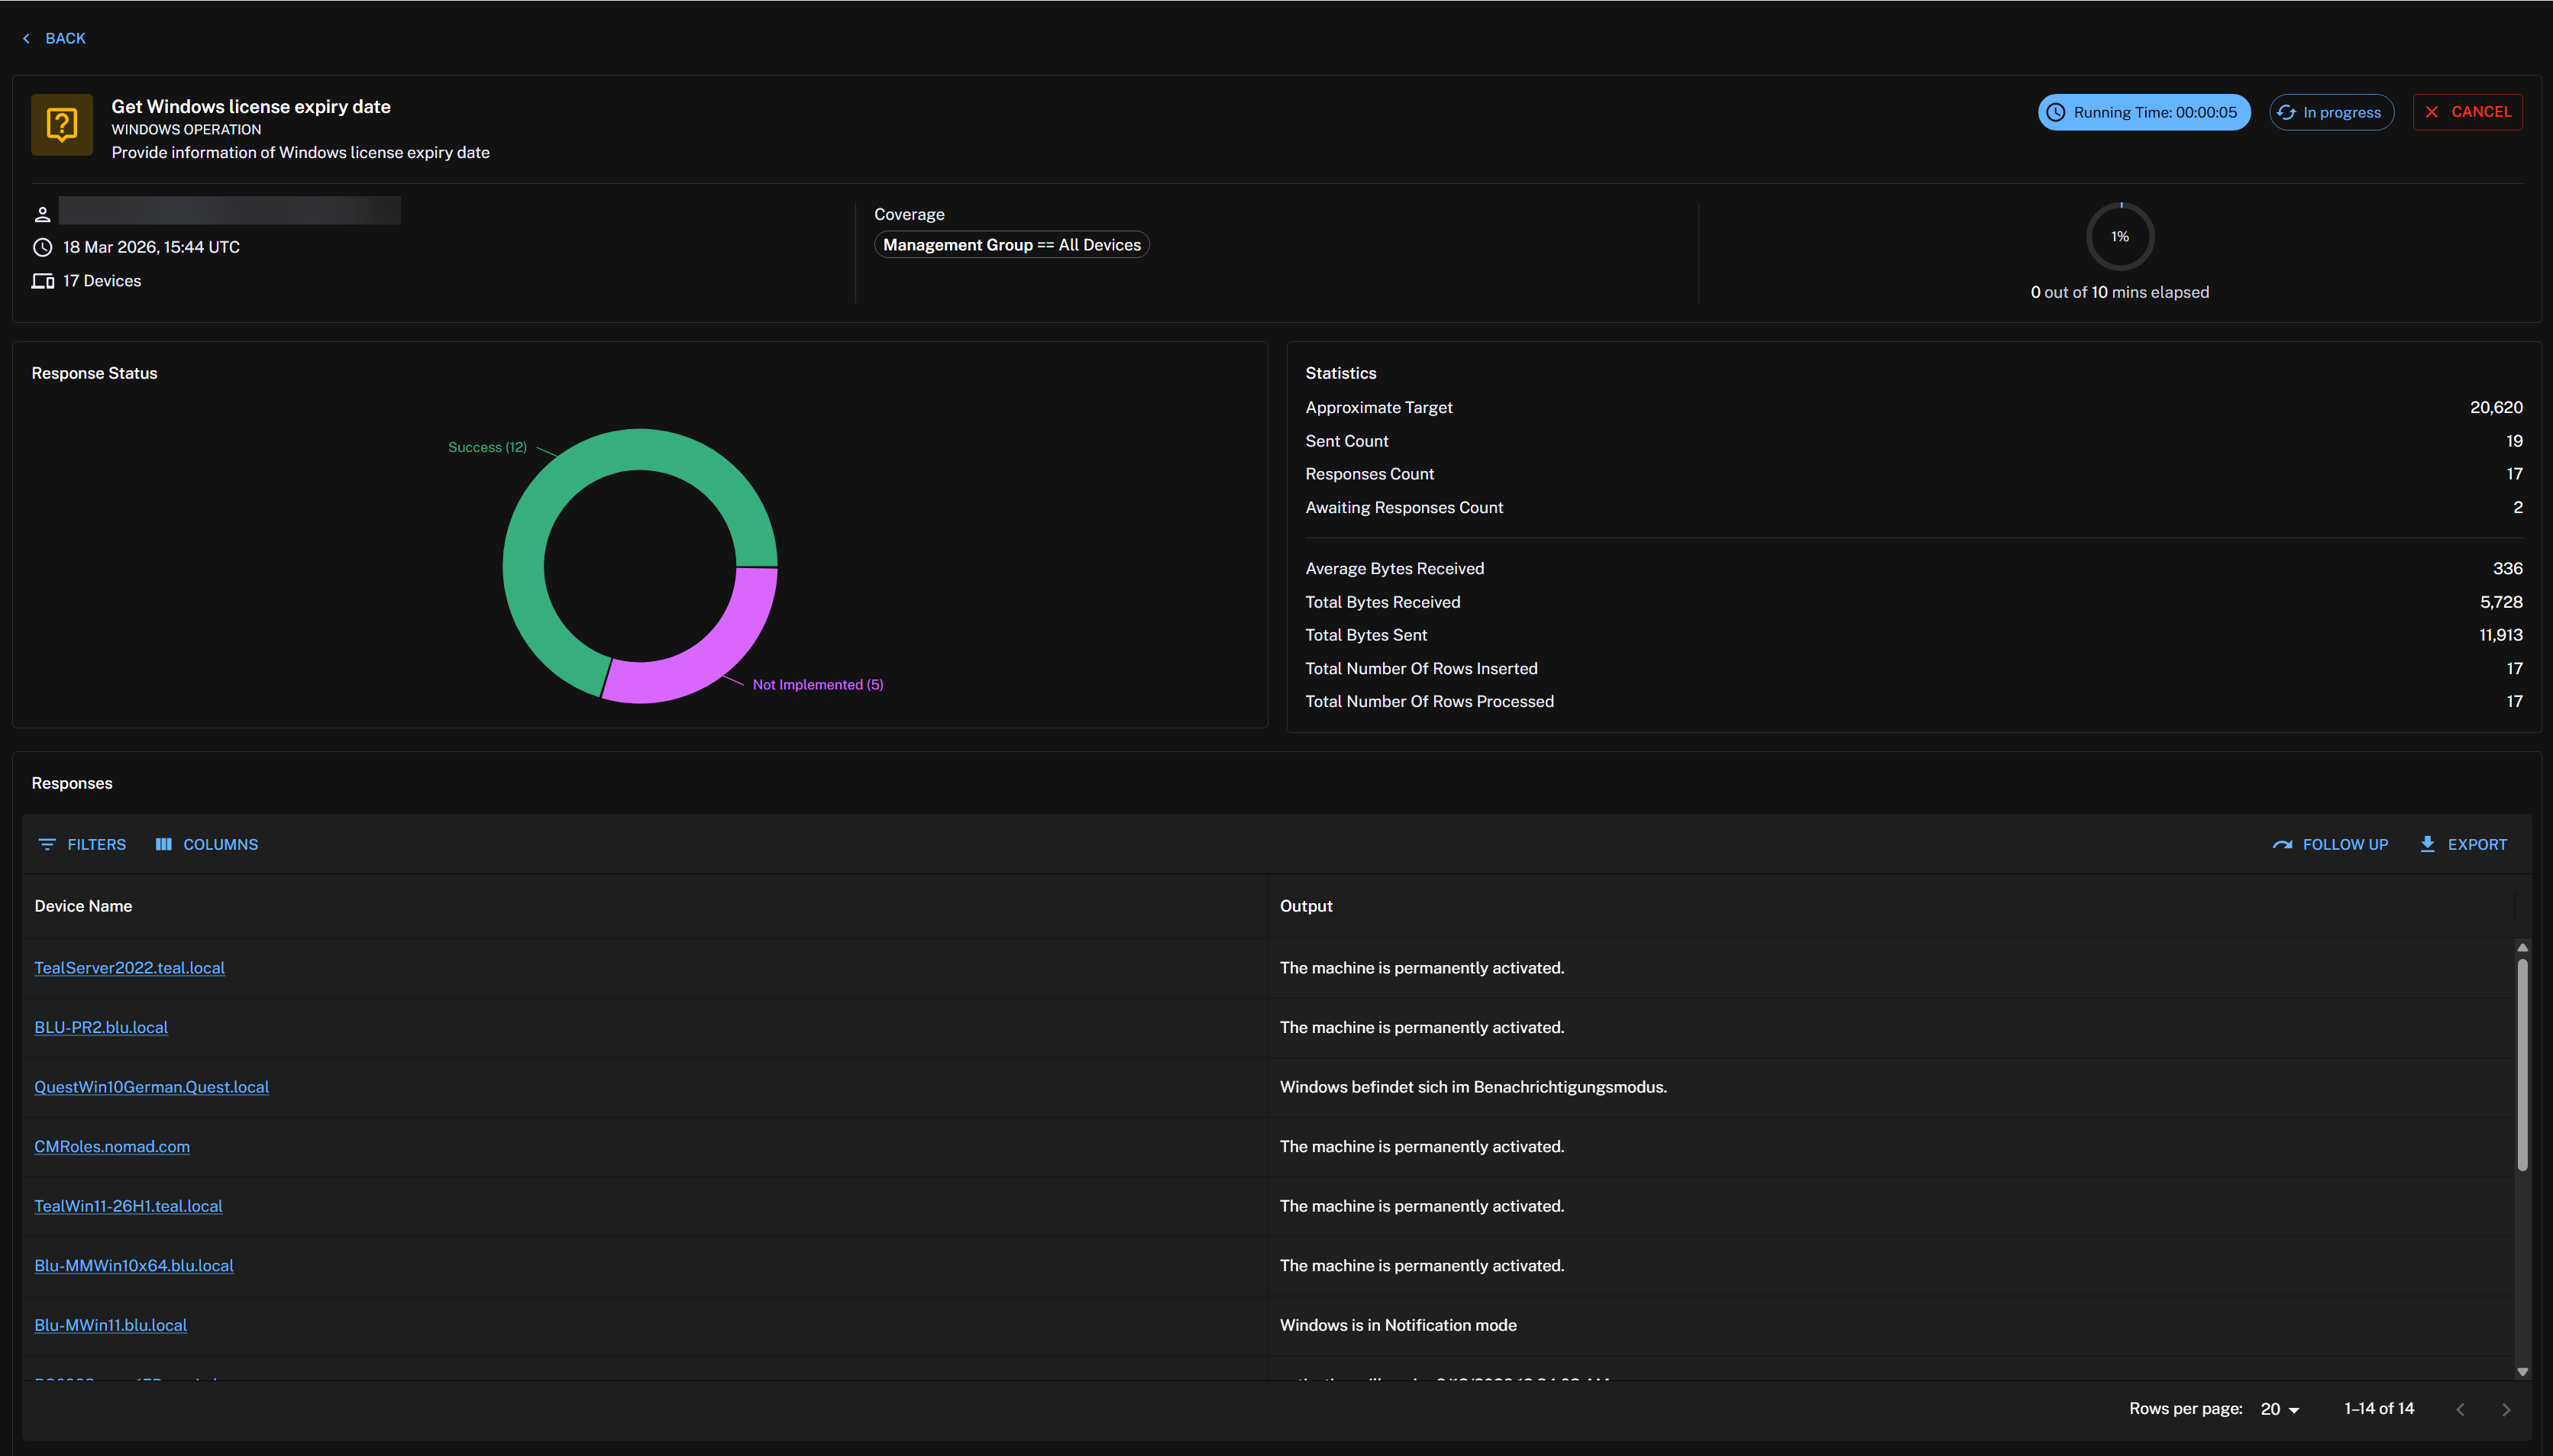
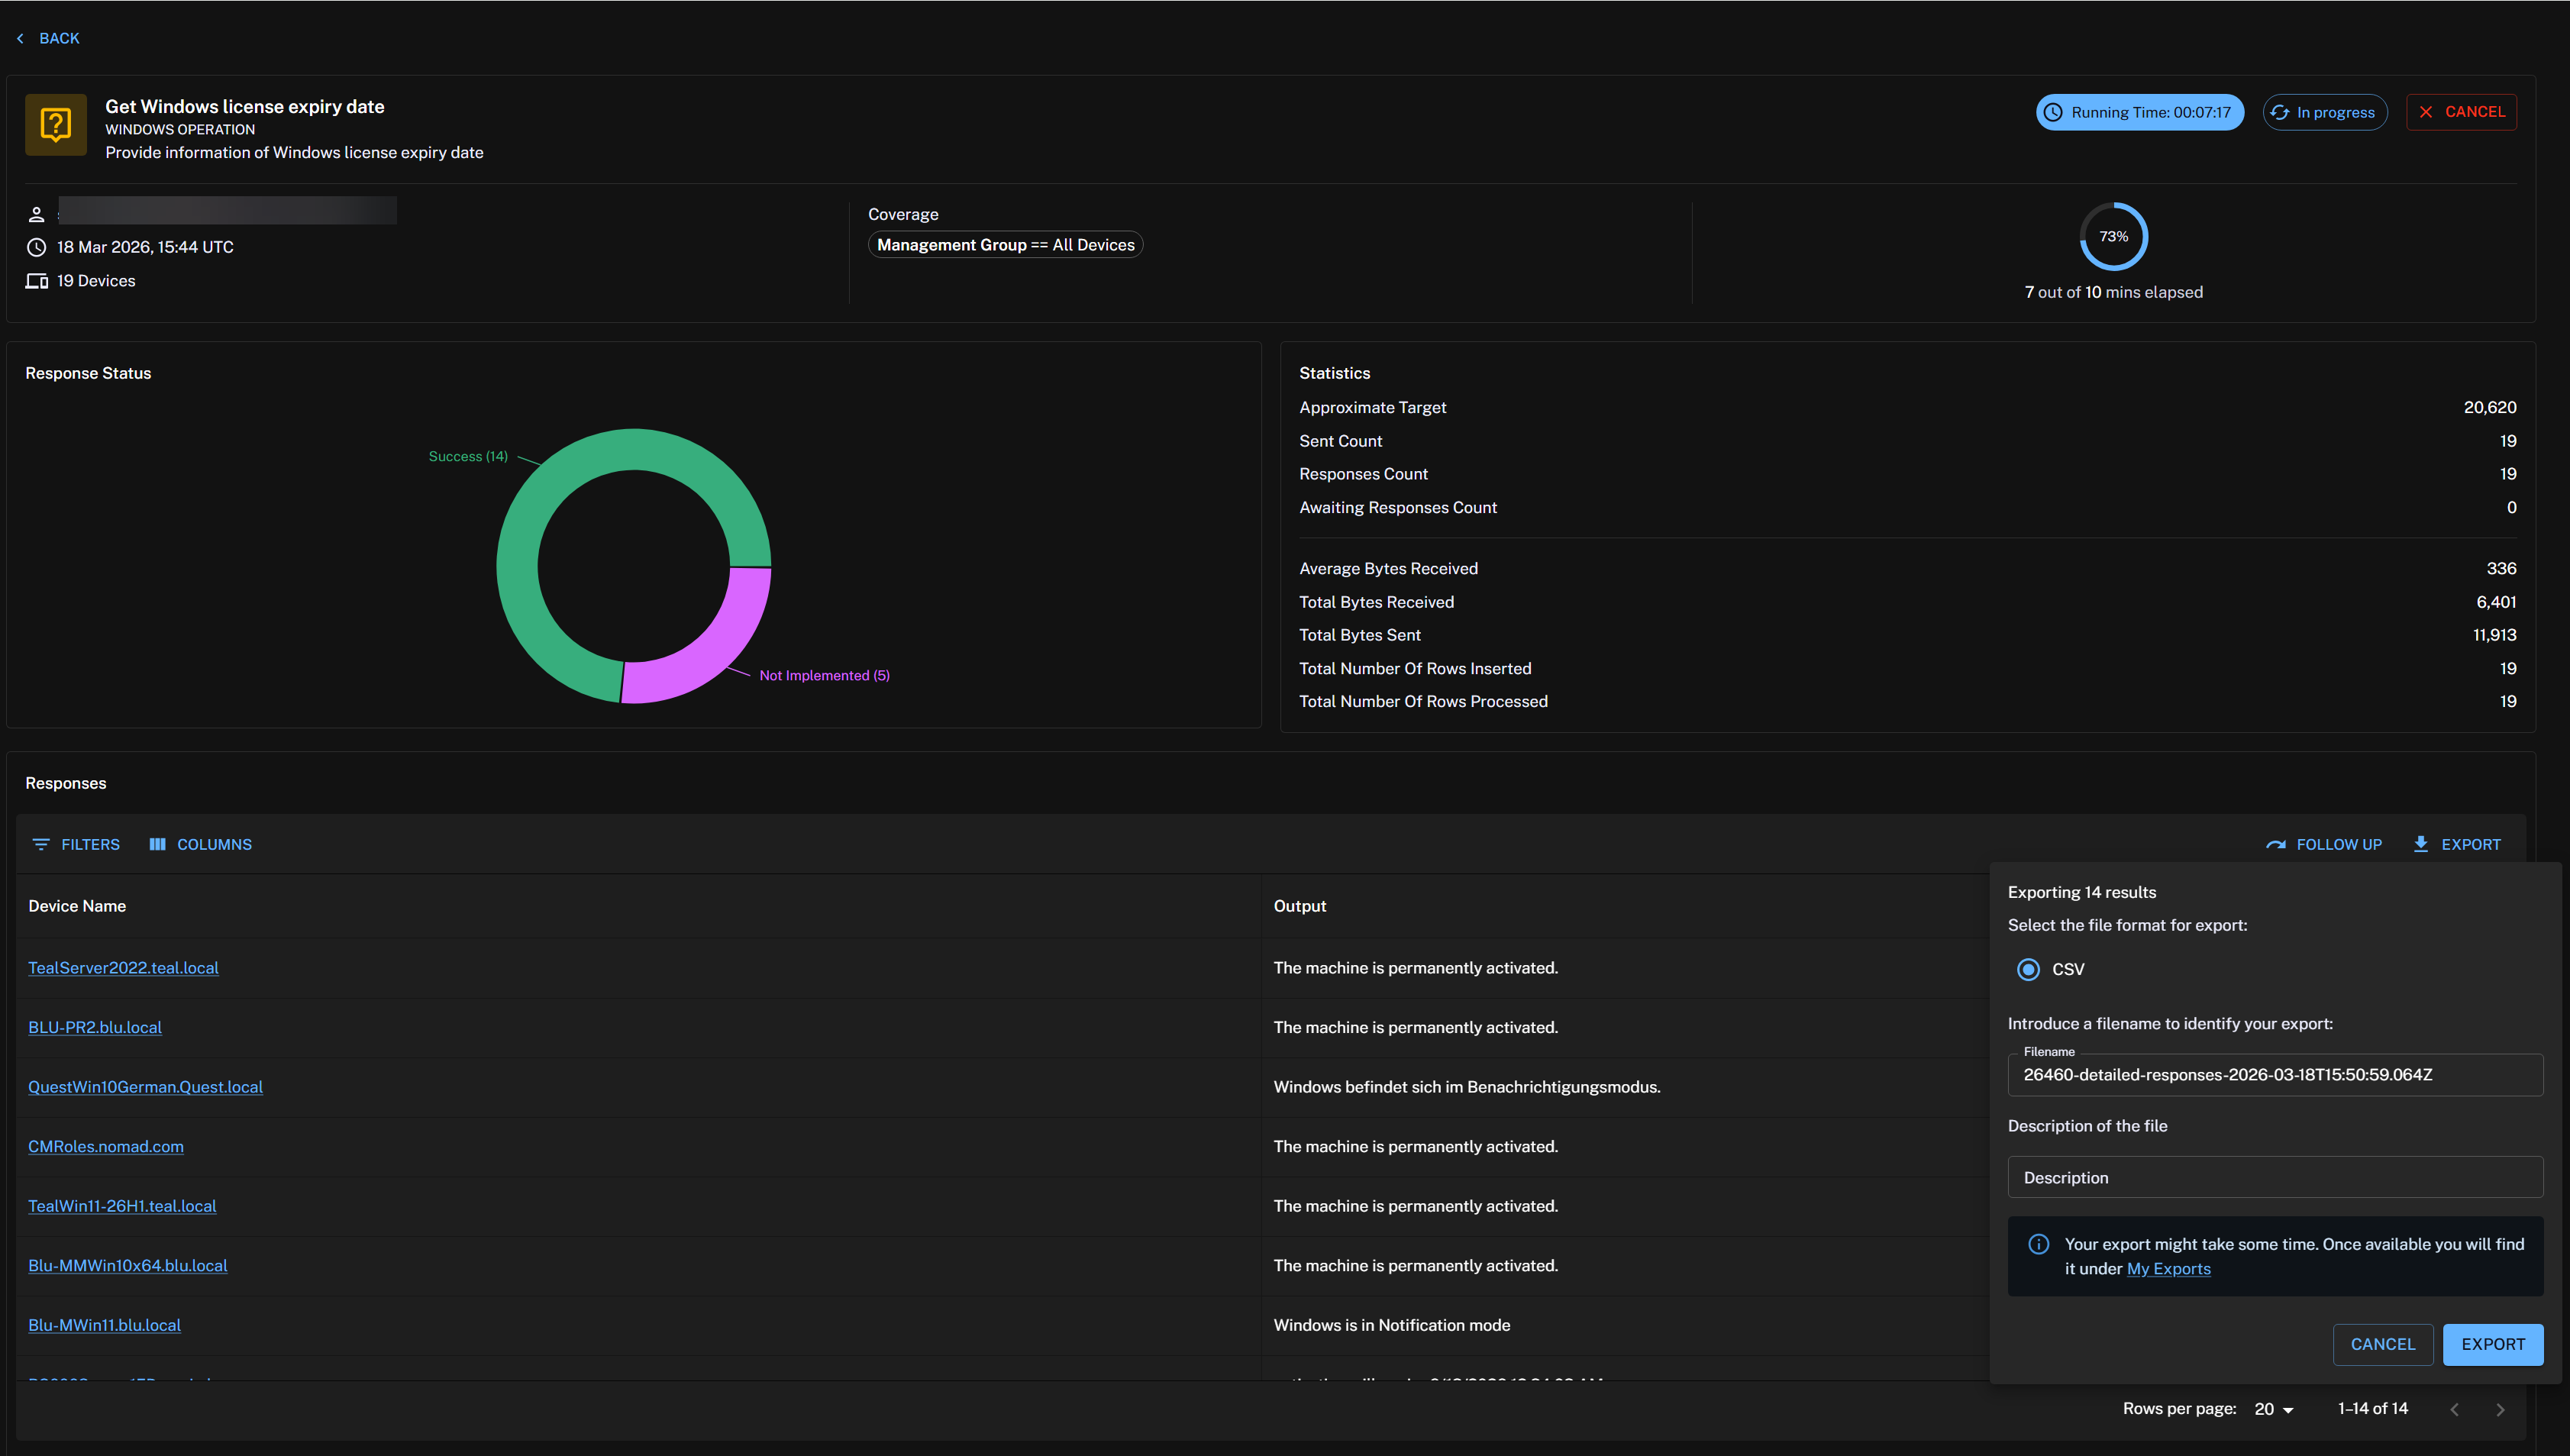
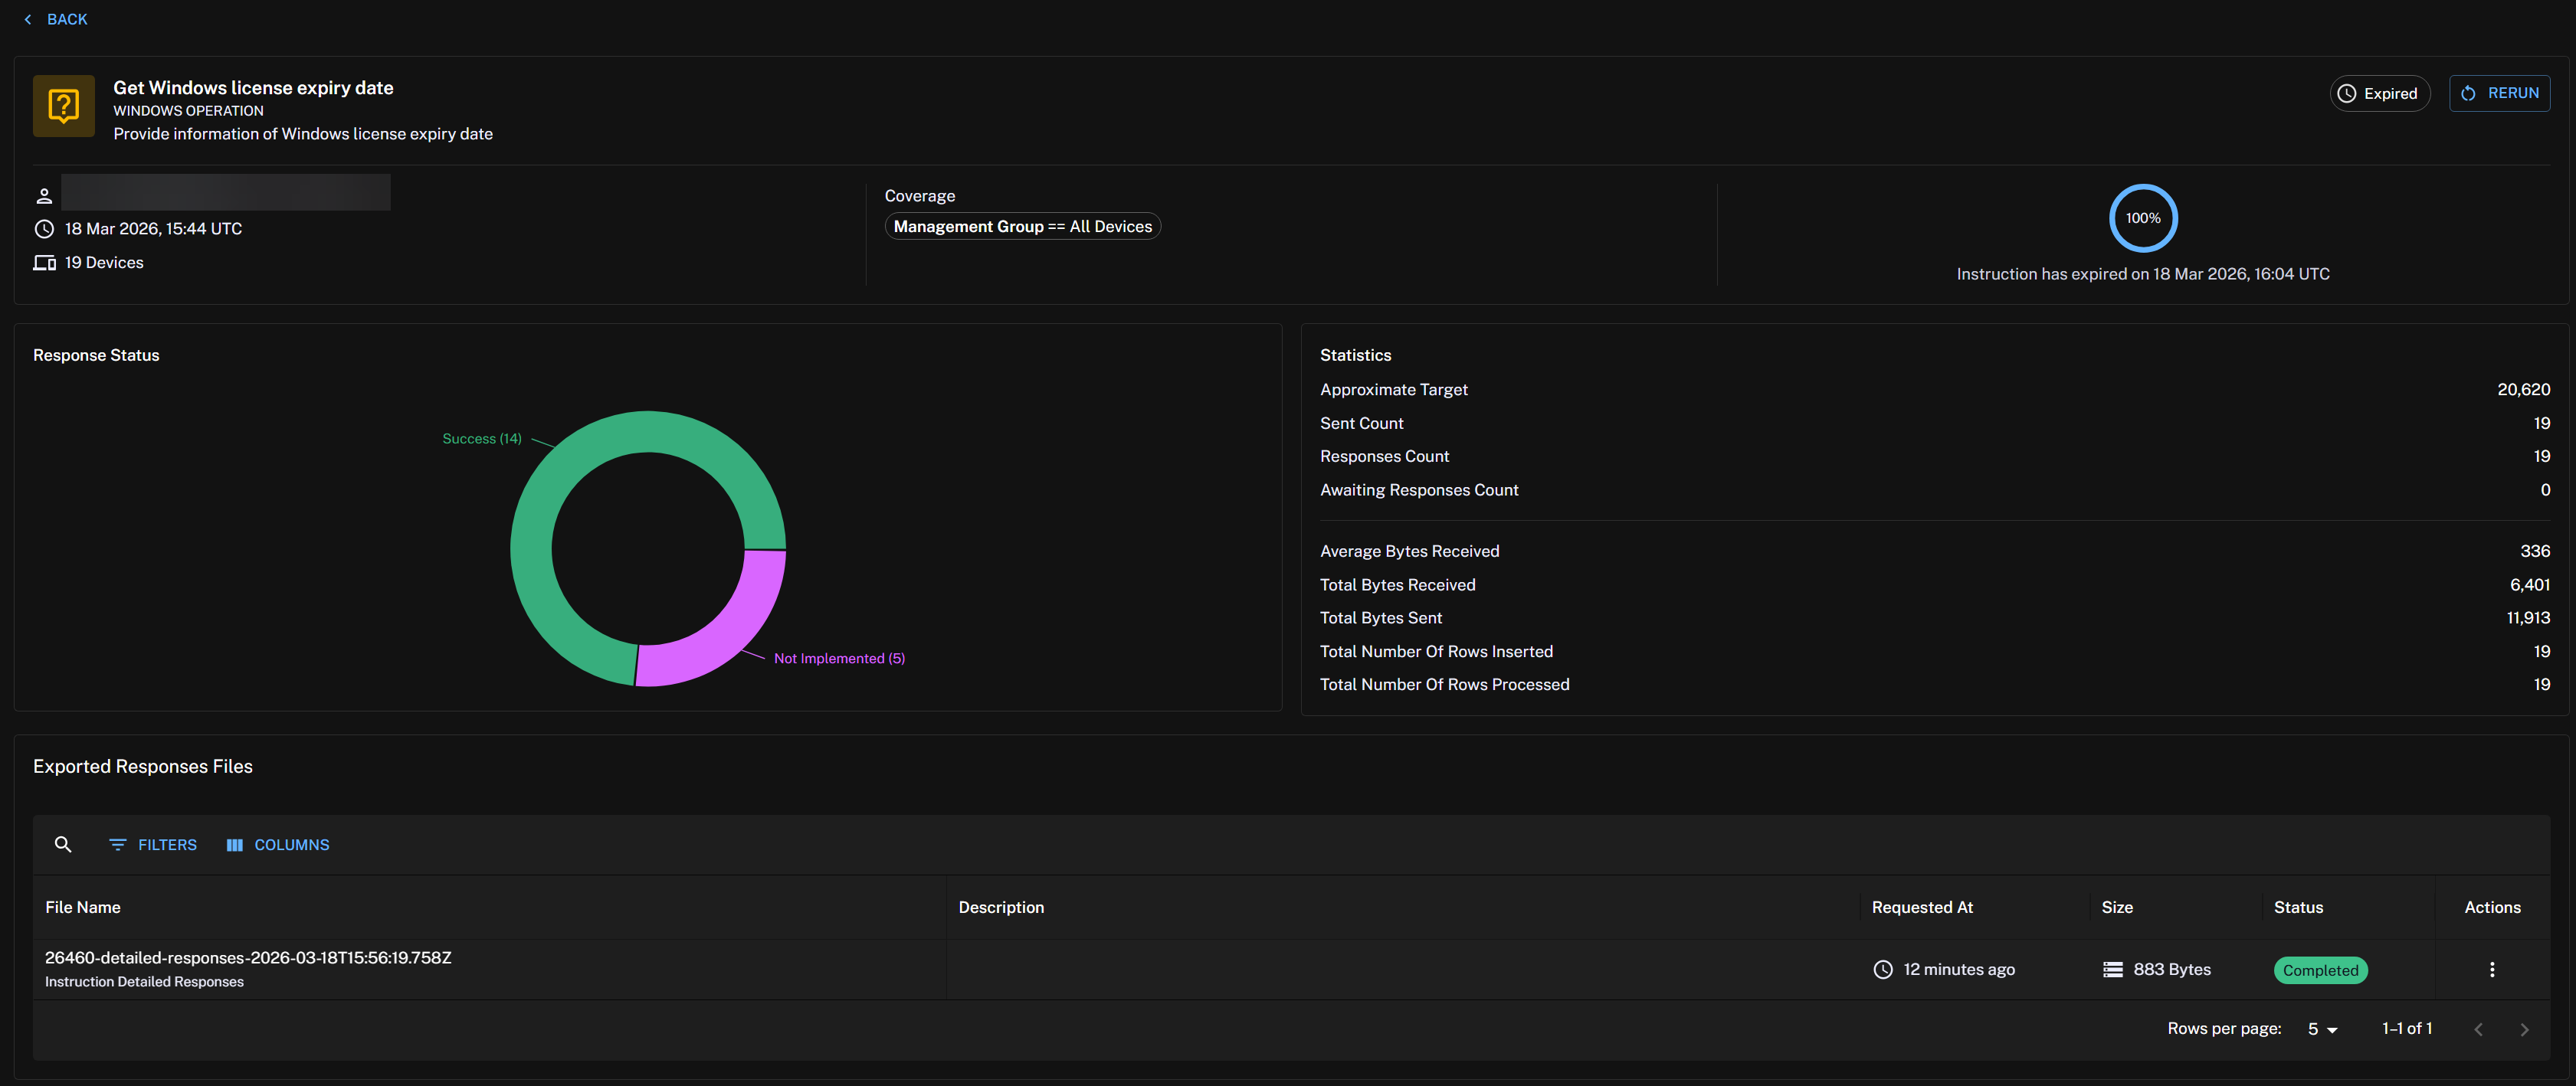
You can Export responses at any time until the responses expires. All the exports will be listed under the Exported Responses Files grid.
-
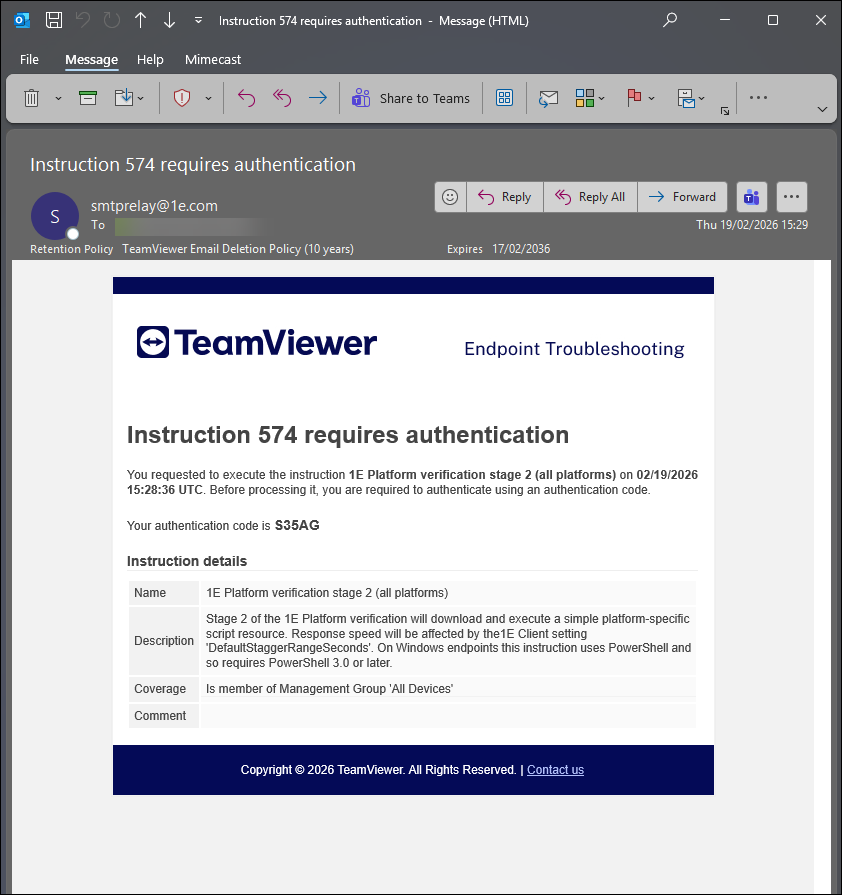
If the instruction requires approval, you will see a page similar to the following:
:
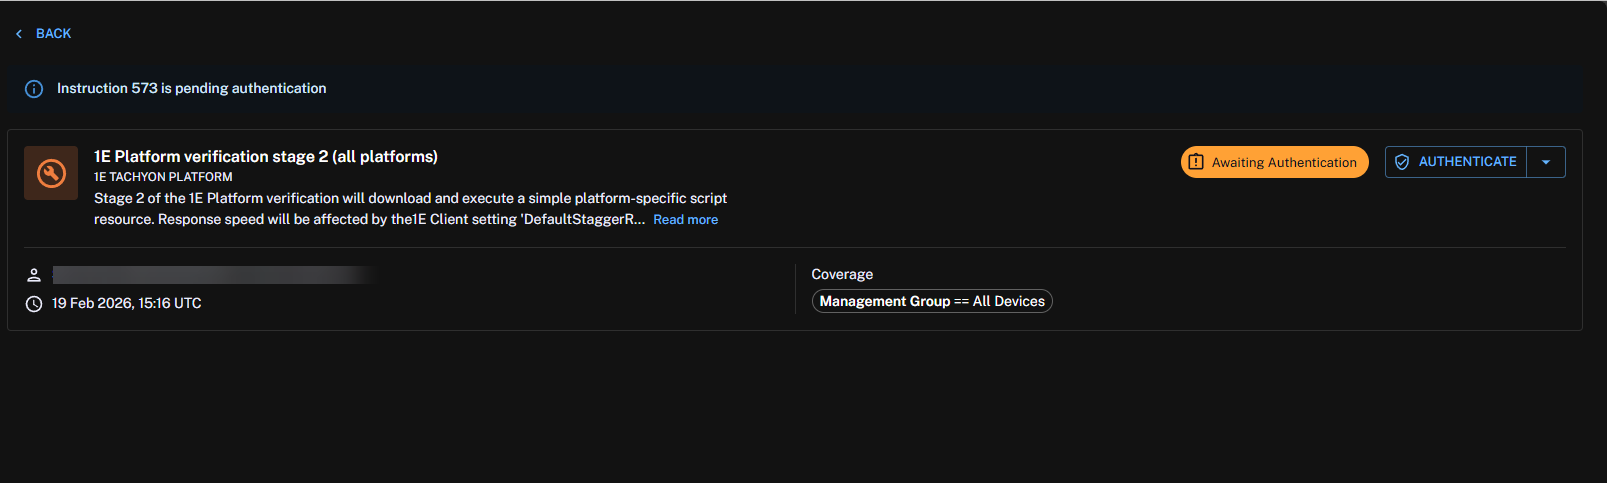
-
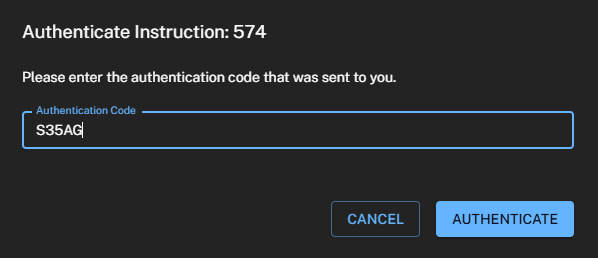
Clicking Authenticate displays the following prompt and an email is sent to an approver. For more information about the approval process refer to The action approval workflow.
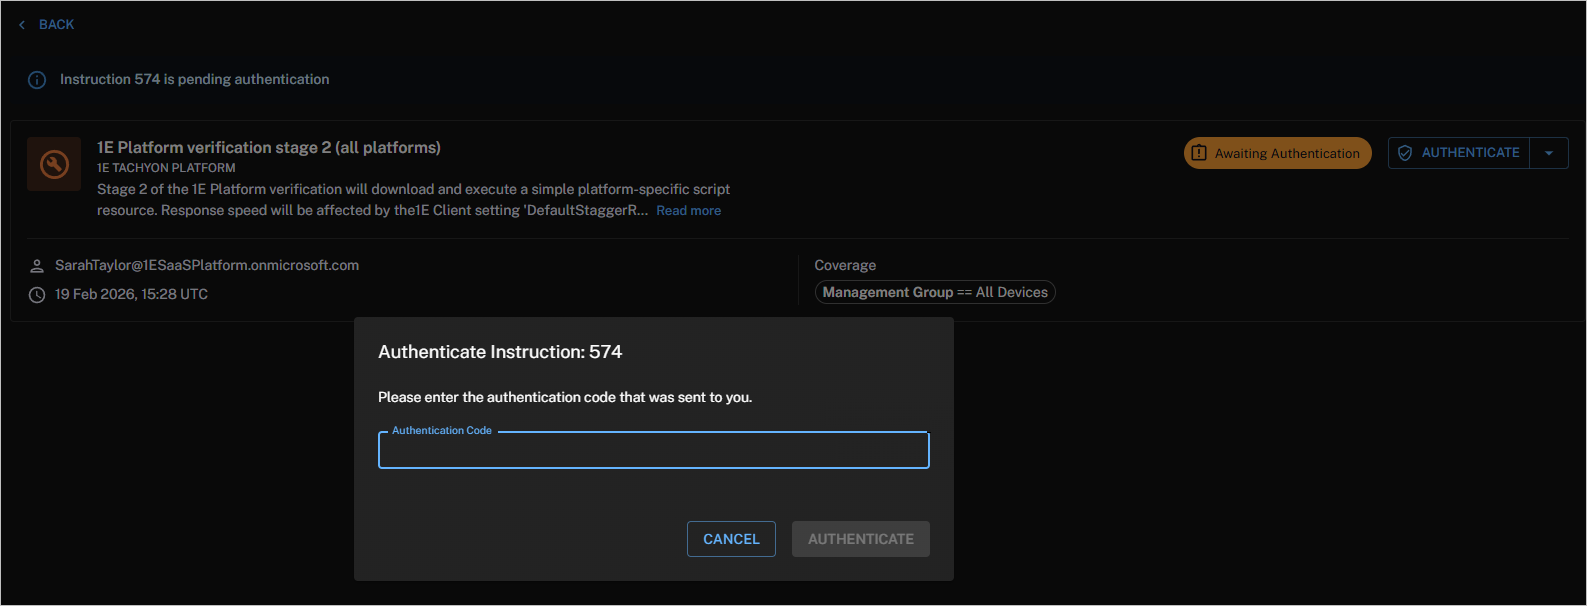
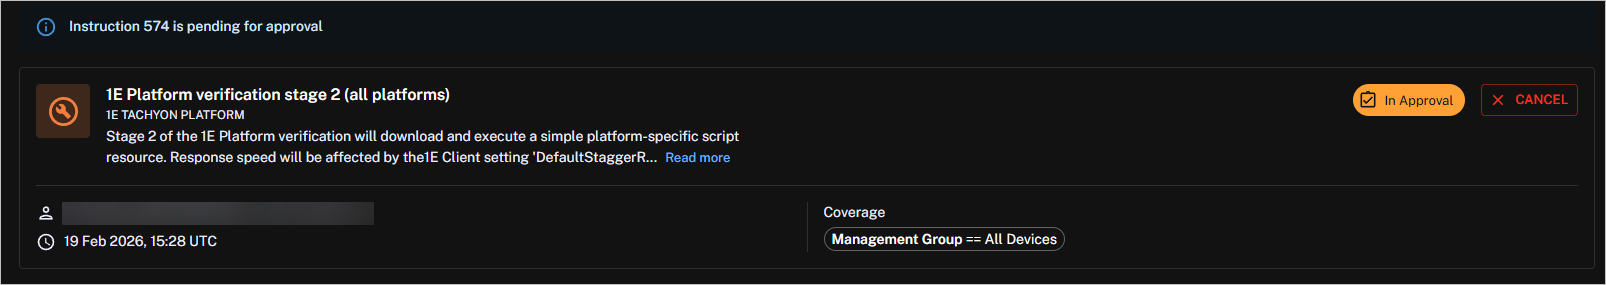
Once the authentication code is entered, the instruction is confirmed as In Approval.
-
You can view a record of instructions sent to your devices and approve them on the Instruction History page, refer to History.
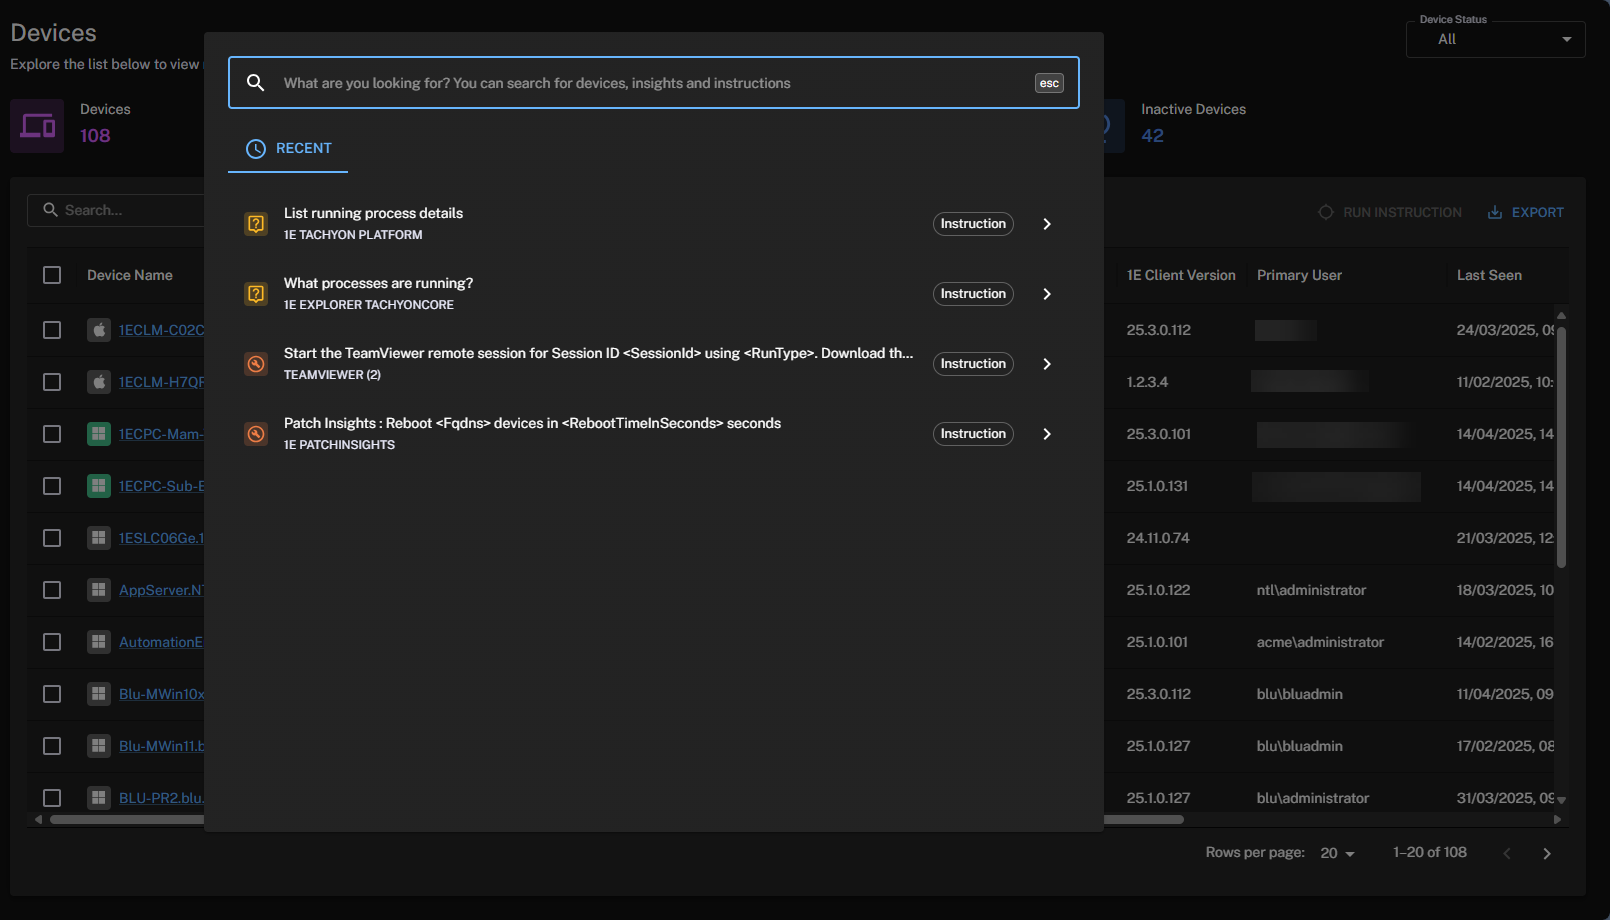
You can also run instructions directly from Search. Selecting an instruction opens the Investigation page, where you can access options such as editing the coverage.
-
Recent searches are displayed when you click Search or use Ctrl + K.
-
Dynamic search returns matches from Devices, Insights, and Instructions. For example, typing run in the search box returns four Insights and 34 Instructions. You can filter results by question or action based on their descriptions.

History
On the History page, you can review running and previously executed instructions to monitor actions and their results:
-
View instruction Status with colored labels to quickly identify the current state.
-
Re-run and approve instructions from the Actions column.
-
Drill down to see summary details, including configuration and audit trail information.
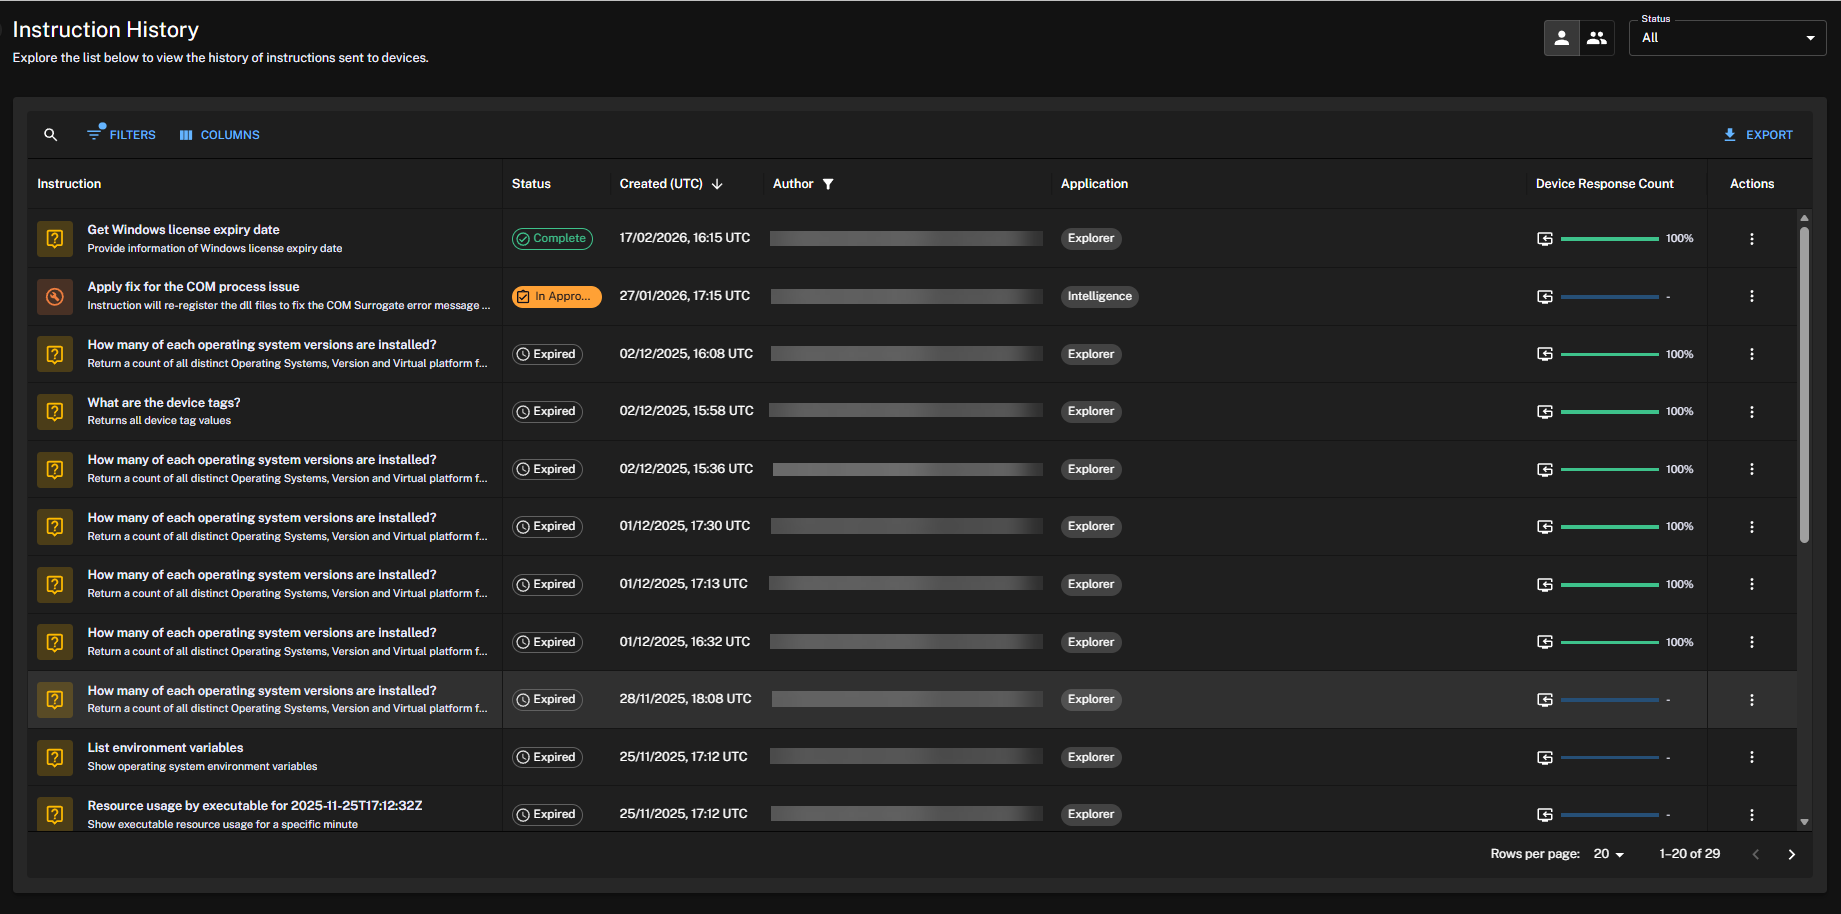
The History page includes these features:
-
Search: A general search field. Your results update as you type.
-
Filters: Filters results by a combination of Column, Boolean Operator, and a free text Value field.
-
Columns: Filters results by column.
-
Views: You can apply saved view settings consistently across tables and screens in the new UI. You can create, manage, and switch between views, and set a default view that loads automatically for a specific table.
-
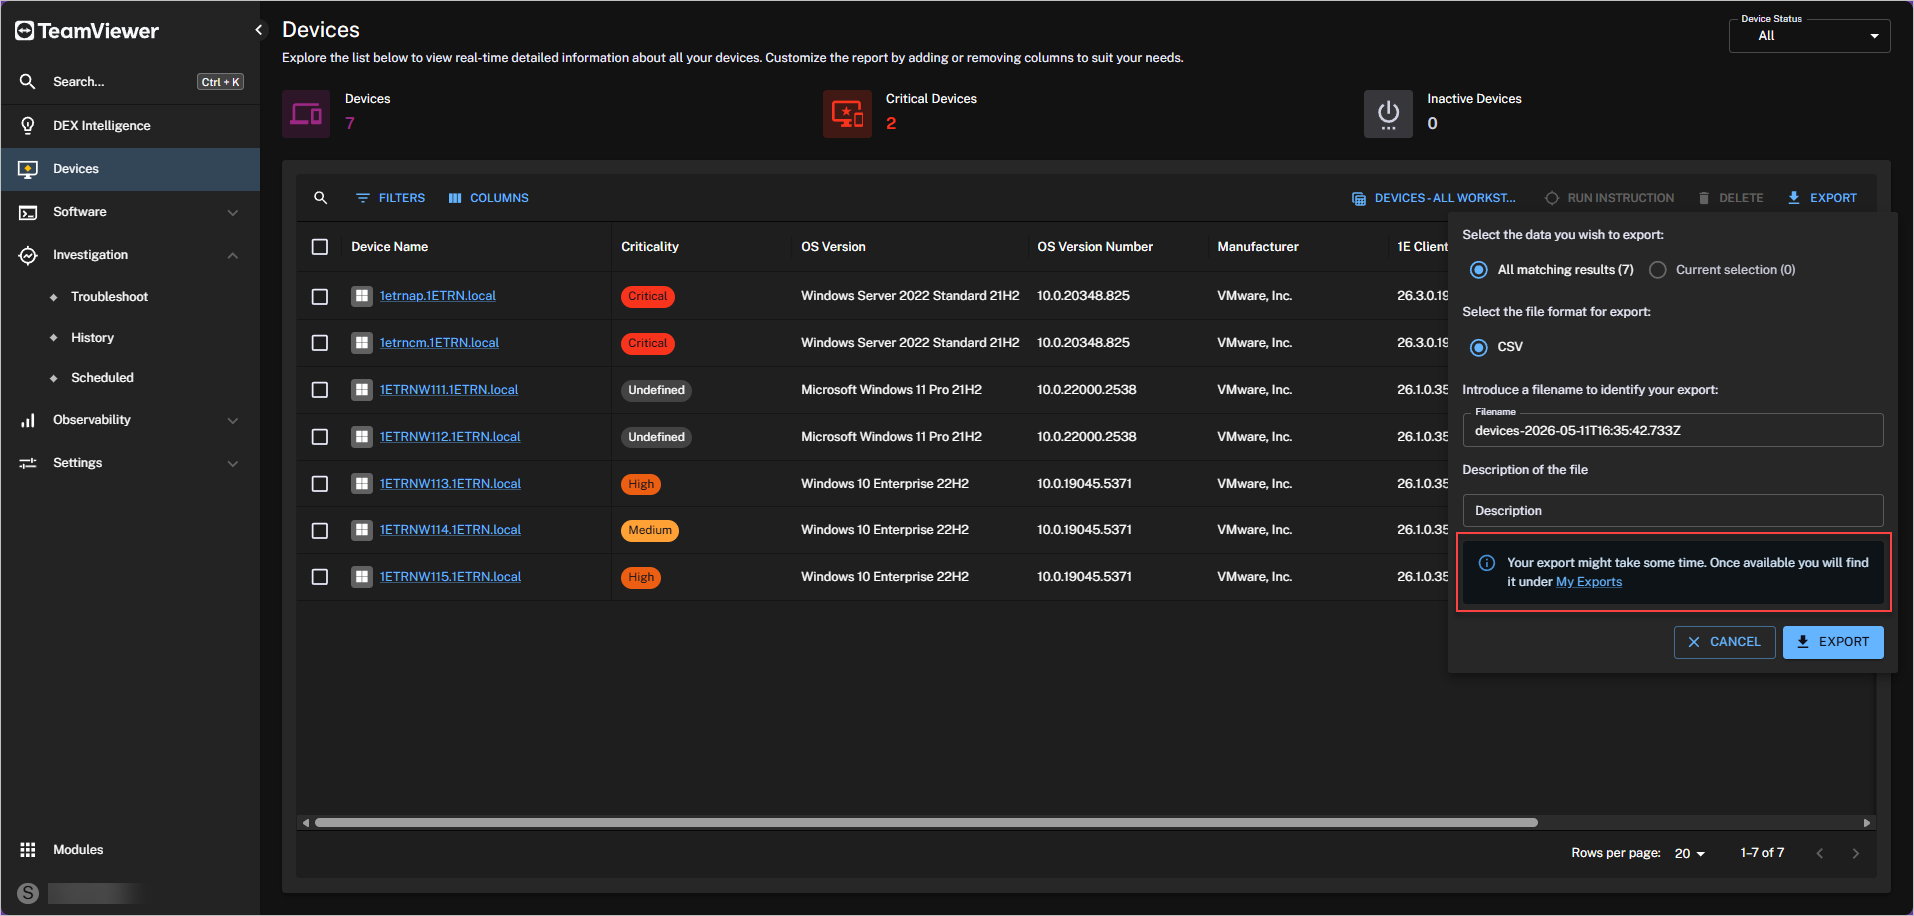
Export: Exports matching results based on your applied filters:
-
Export large datasets from Software, Device, and Intelligence sections, allowing you to continue working as exports occur in the background.
-
Track export jobs in one place, allowing you to monitor progress, download completed files, and manage past exports which you can Download or Delete from the Action menu.
-
Your exports might take some time depending on their size.
-
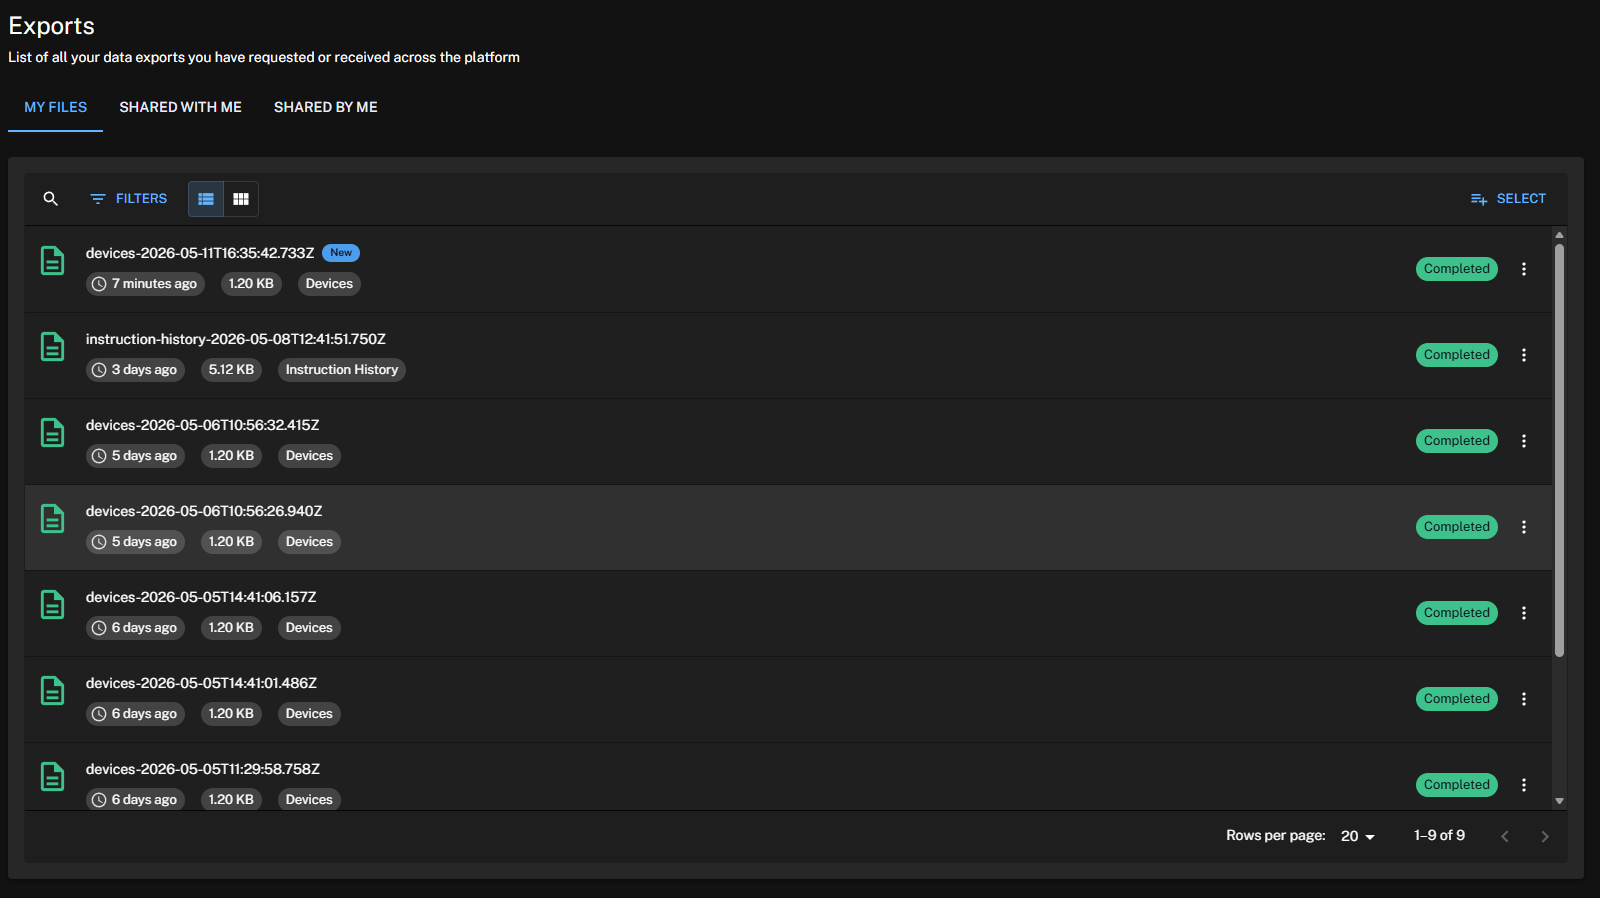
A badge notifies you when an export is ready for use.
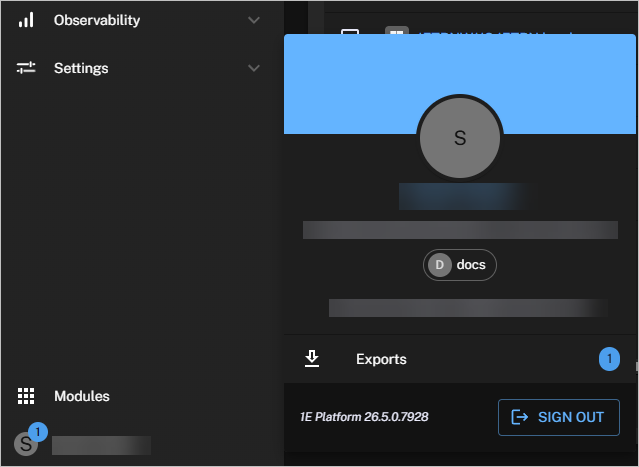
-
You will find your exports on the Exports page by clicking Exports from your profile. You can share your exported files with teammates, and you can revoke access to shared exports at any time.
-
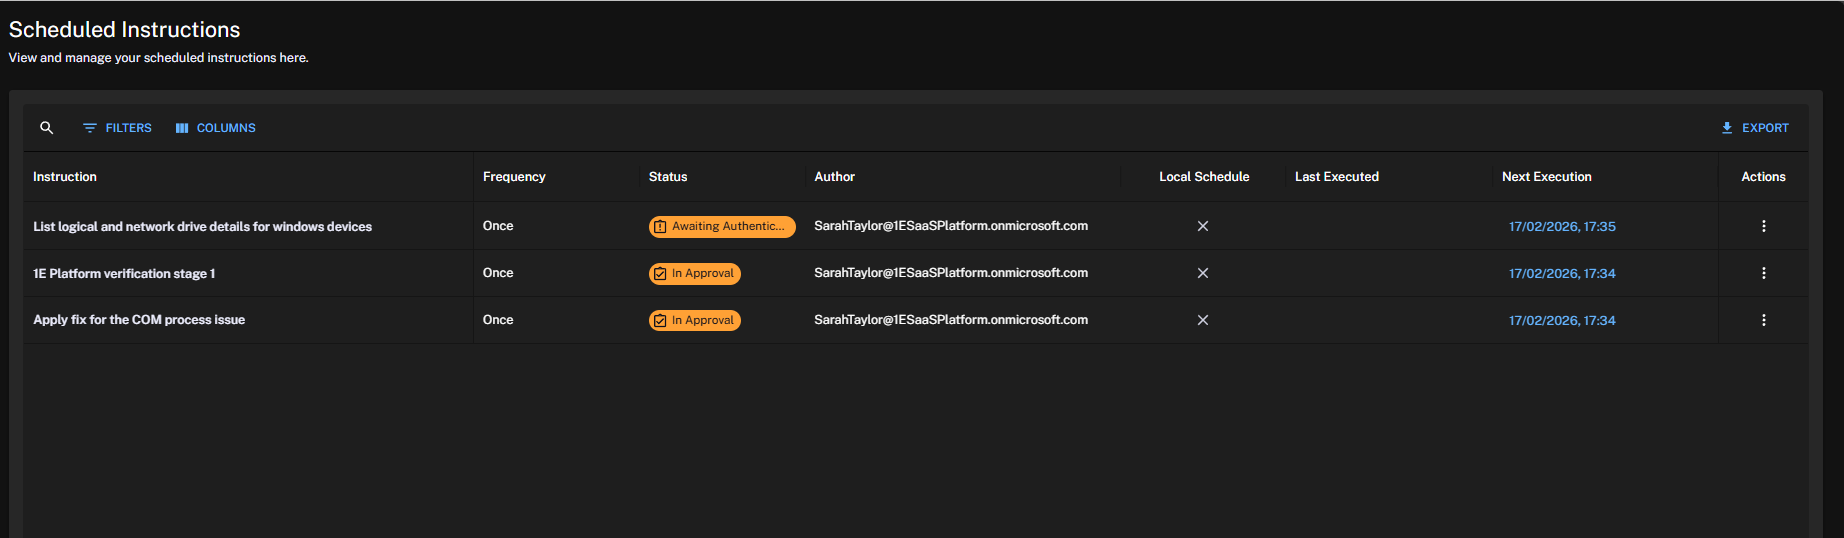
Scheduled
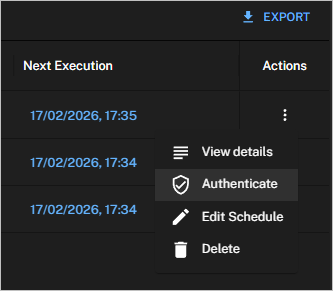
View and manage all instructions scheduled for future execution. You can filter and sort data to find a specific instruction, and use the Actions column to view details, authenticate, edit the deployment schedule, or delete the instruction.
Using the classic UI
Endpoint Troubleshooting involves framing questions that allow you to quickly access and explore information on connected devices.
Choosing your instruction
Clicking on All instructions lets you browse through all the currently installed instructions using groups with the following options:
|
Group by |
Description |
|---|---|
|
Instruction set |
This option groups instructions by the instruction set they belong to. You can click on an instruction set to expand and collapse a list of its instructions. An instruction can only belong to one instruction set. |
|
None |
This option lists all of the instructions without sets. |
You can see the instruction type (question or action), name and description.
The example shows the following steps:
-
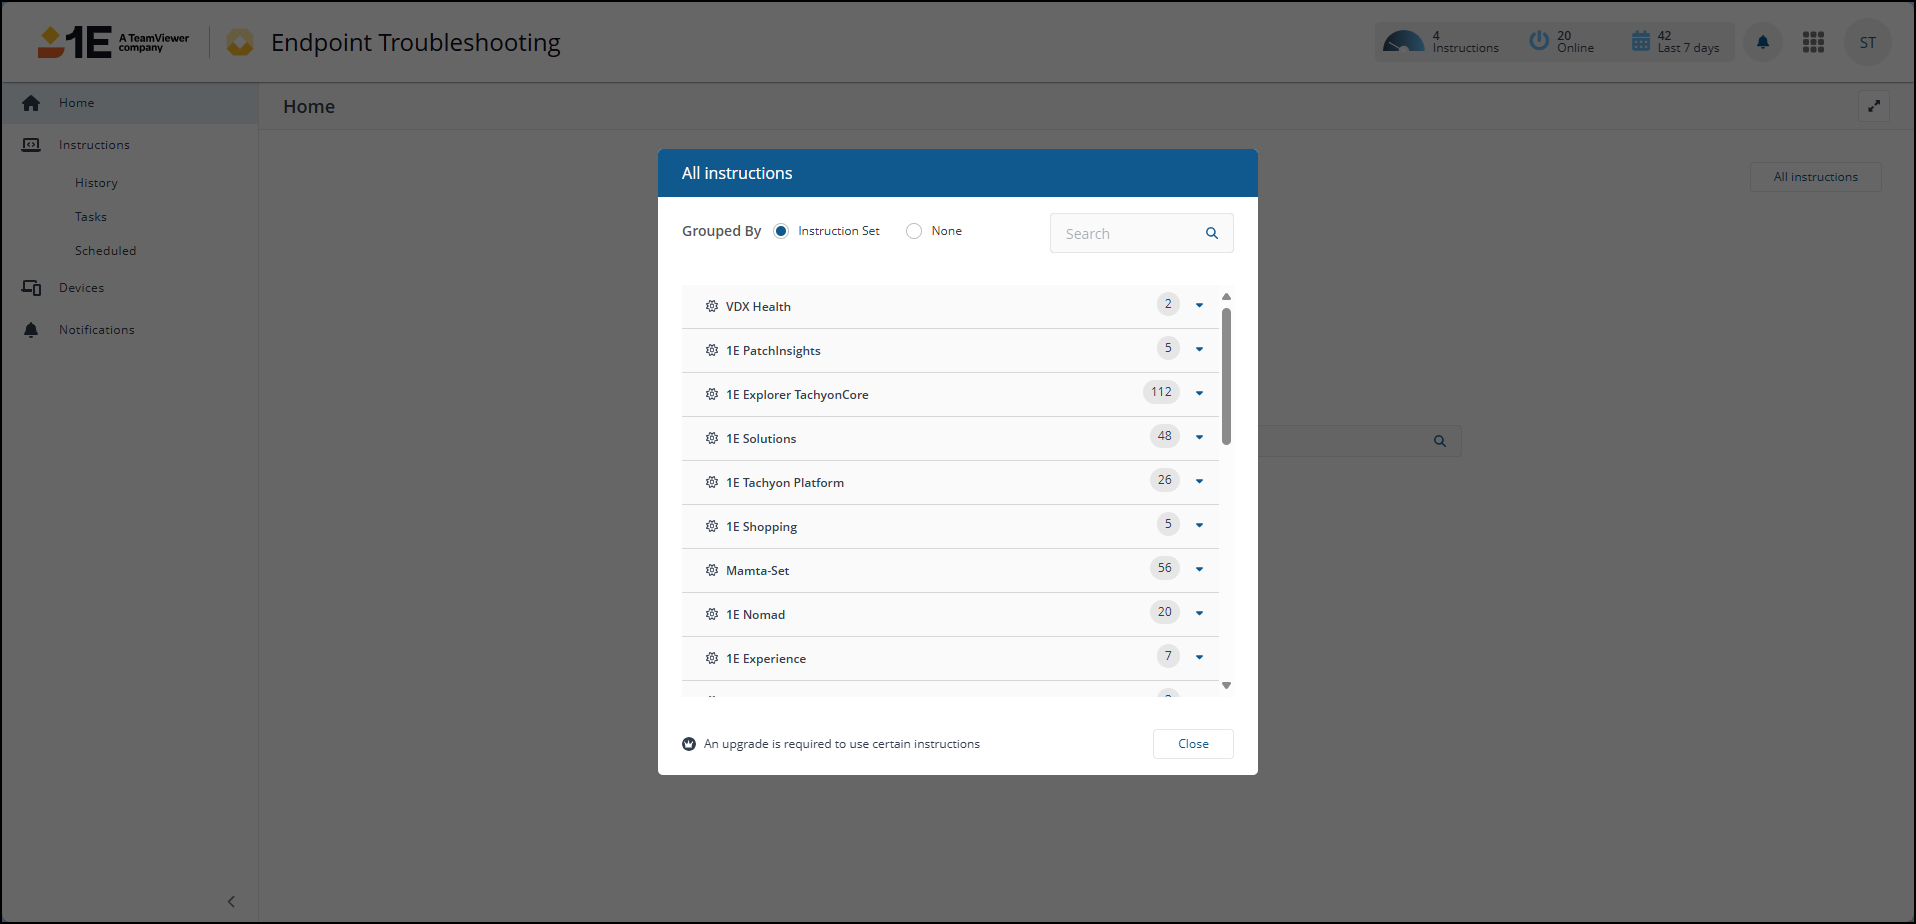
The user selects the All instructions dialog for a system which already has DEX Packs added.
-
In the All instructions pop-up the user then takes a quick look through the available Instruction sets as selected in the Group by options.
-
You can expand each of the Instruction sets and select the instruction that you want to run. In our example the user expands the 1E TachyonCore set and then selects the How many of each operating system versions are installed? question.
Selecting the question loads it into Endpoint Troubleshooting. You can see the text for the question loaded into the question box with its operational parameters laid out underneath.
The following table describes the available parameters:
|
Parameter |
Description |
|---|---|
|
Duration |
|
|
Approximate Target |
|
|
Projected Impact |
|
|
Options |
|
To ask a question you Ask this question below the parameters. When a question is asked, the view automatically switches to its Responses page and provides immediate feedback on how the question responses are coming in. The Responses from value at the top-right of the page displays the number of devices that have responded. In our example all 12 devices respond.
The selected Instruction displays a response visualization chart and returns a list of responses. You can switch to the list by clicking the List view icon.
Interacting with a response visualization
Some questions provided in DEX Packs are defined so that their responses can be viewed as graphs.
In our example we want to know which processes have made the most connections to the Domain Controller for our example environment in the past 10 days. The question we will ask is: Which processes have made connection to <ipAddresss> in the last <numDays> days?. This question will return the information so that it can be reviewed as a graph. It also makes use of Client Activity Record, where potentially useful information about network and device performance is gathered and held by the 1E client.
The example shows the following steps of the example:
-
On the Endpoint Troubleshooting home page the TCNQuestioner01 user types the text 'which processes' into the text box and then selects the Which processes have made connection to <ipAddress> in the last <numDays> days? question from the matching list.
-
They then set <ipAddress> to 100.100.100.100 (the IP address for the ACME Domain Controller) and <numDays> to 10.
-
Once the parameters are set they then click on Ask this question and the clients respond with the list of Process Names that have connected to that IP address.
-
You can interact with the charts, toggling the display for each individual process between on and off, by clicking on the name of the process displayed beneath the chart. In our example TCNQuestioner01 toggles the display of each process with the highest number of connections off to reveal the processes with less connections.
-
You can also investigate the individual data nodes of the graphs by hovering the mouse over the points. Here the user looks at each node in turn for ccmexec.exe.
Checking the status of responses using the summary tab
In the example we show how the Summary tab on the Responses page can be used to check the status for the responses to a question. To check the Response page Summary tab we will run a Configuration Manager client health check question.
-
From the Tasks view navigate to Software Vendors > Microsoft > Configuration Manager
-
Select the What is the health of my SCCM clients? Check that inventory has run and that policy has been evaluated in the last <numdays> days. question.
-
Set <numdays> to 7 and click Ask this Question.
-
When the responses start coming in for the question, select the Summary tab to see how they are progressing.
On this page you will see some statistics related to the question responses and some charts that display the information graphically.
The Sent Count chart shows the total number of questions that have been sent and the balance between the responses that have been received and the awaiting responses. As each response comes in the percentage of Responses goes up and the Awaiting goes down. This is also seen in the actual values for the Responses count and Awaiting responses count.
The Responses Status chart shows the status for each response as it comes in. For each response the status may be one of the following.
|
Reponses |
Description |
|---|---|
|
Success |
Devices that have responded with a success status. |
|
Success - no content |
Devices that have responded with a success status but did not provide a response to the instruction content request. |
|
Error |
Devices that have responded with an error encountered when attempting to run the instruction. |
|
Not implemented |
Devices that have responded where the feature contained in the instruction is not implemented on the device. |
|
Response too large |
Devices that have not been able to respond to the instruction content request because their response was too large. |
In our example, eventually the Responses count in the Percent Sent Count chart rises to 100% indicating that all the responses have been received now (for the devices currently connected).
-
We can now check on the Status tab to investigate the reasons for the response statuses we've seen.
-
Expanding the Not implemented row, we can see that our Linux device cannot run this instruction because it uses a PowerShell script that is not supported on the Platform.
-
Expanding the Error row, we can see that one of our Windows 7 devices generated a PowerShell error.