Liveboards
 |
|  |
| 
From the 26.3 release, Observability uses the Experience data model as the basis for its reports, so all reports are based on Experience data. For more information, refer to Experience Analytics.
Learn how to create and use Liveboards to organize reports, visualizations, and key metrics into interactive dashboards for monitoring endpoint health and operational performance. This guide explains how Liveboards help IT teams track trends, share insights, and make faster, data-driven decisions across the Platform.
Liveboards enable you to consolidate related reports in a single view, allowing you to monitor trends, investigate issues, and revisit important insights.
Key features and benefits include:
-
Centralized dashboards: Organize related reports and visualizations in one place.
-
Seamless workflow: Create a Liveboard directly from an existing report.
-
Interactive reporting: Explore data, identify trends, and investigate areas of interest.
-
Reusable dashboards: Revisit and share reporting views.
-
Flexible data model support: Liveboards are designed to support reports from any reporting data model as they become available. Currently, reporting is based on the Experience data model, with additional models planned for future releases.
To create a Liveboard, first generate a report using Tia Reporting, then add the report to a new or existing Liveboard. Refer toReporting.
Creating a Liveboard from a new report
You can create a Liveboard directly from a report in Tia Reporting to organize insights, monitor trends, and build reusable dashboards for ongoing analysis.
To create your first Liveboard:
-
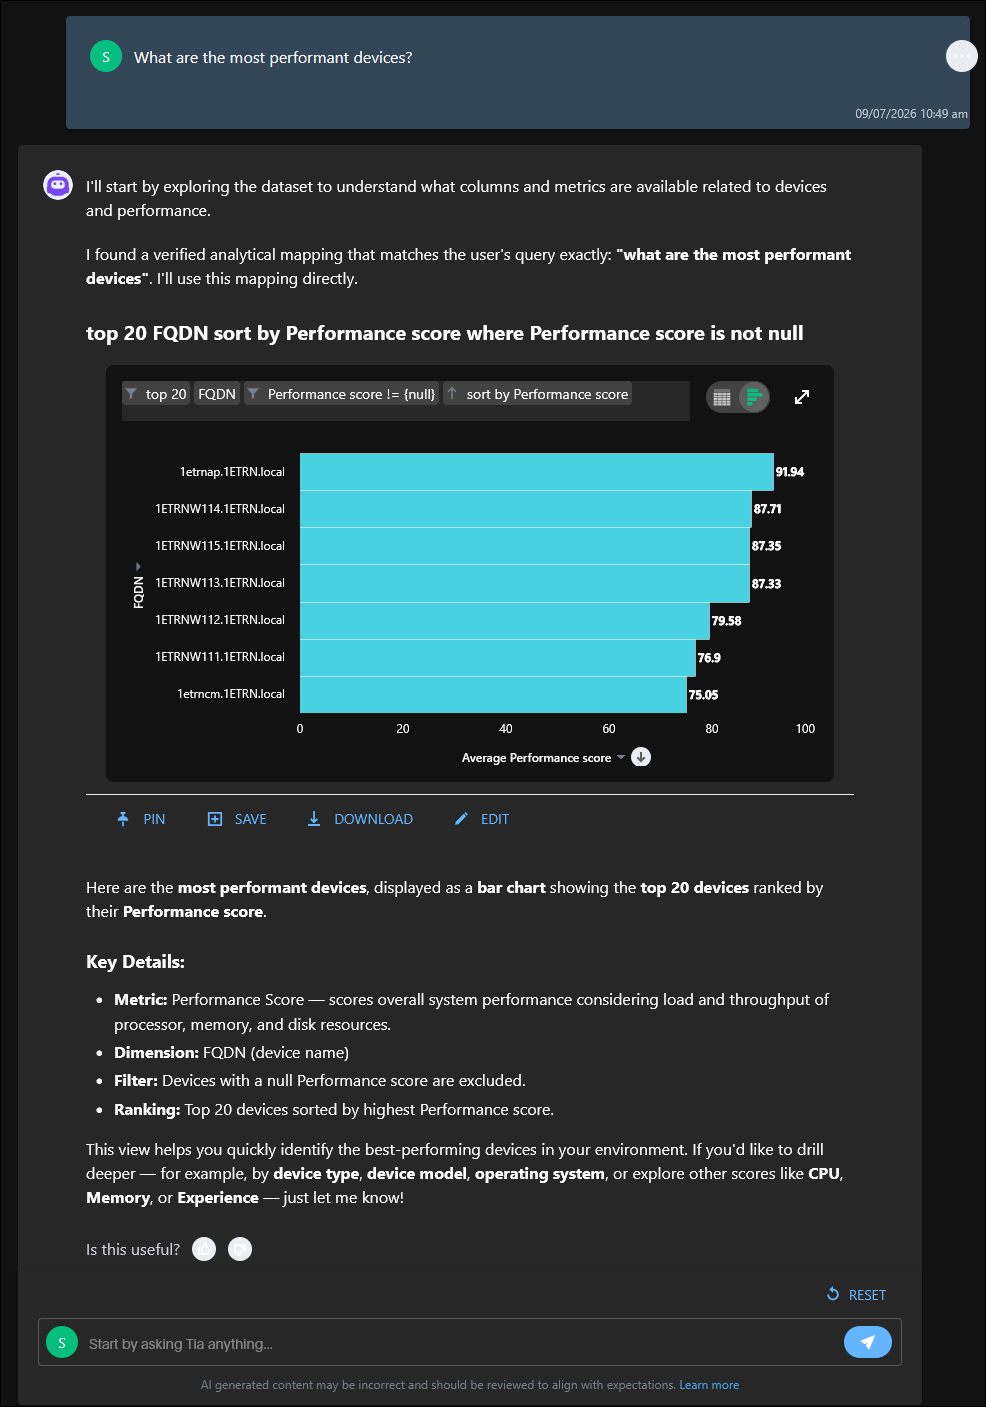
Create a report. In this example, we have used a suggested prompt, “What are the most performant devices?” where Tia generates a report-ready visualization of the top twenty FQDN sorted by performance score.
-
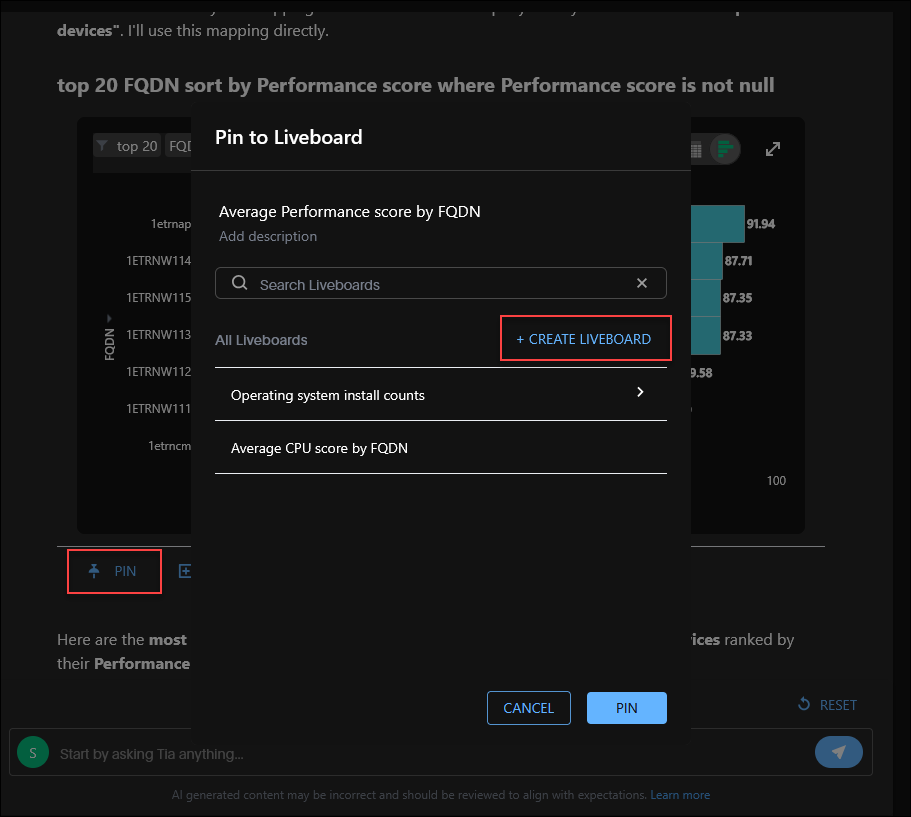
After creating the report, we click Save. We then select Pin to add the report to an existing Liveboard or create a new one.
Reports do not need to be saved before being added to a Liveboard.
If you Pin an unsaved report, it immediately becomes part of the Liveboard, and because there is no standalone saved report behind it, any future edits to that report are made directly from within the Liveboard itself.
-
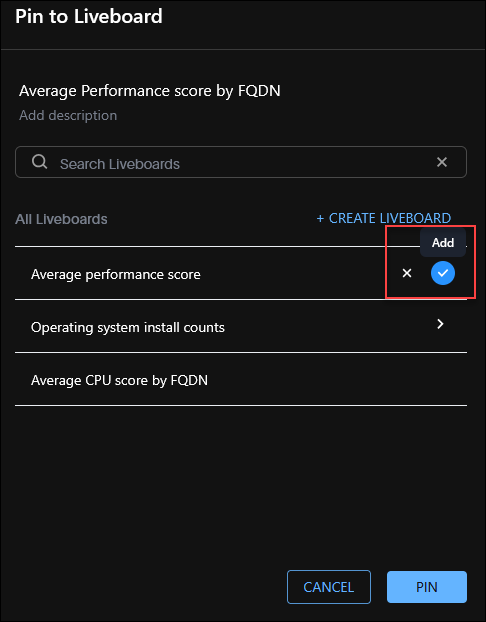
We chose Create Liveboard and created one called Average performance score because there are no existing boards that match the new report data.
-
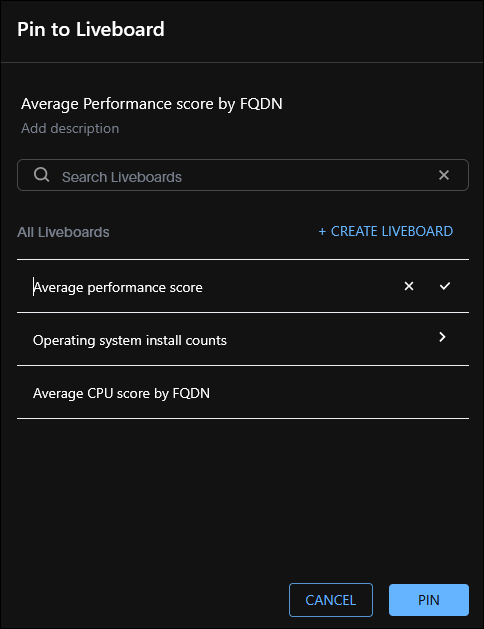
Once the board is named, we make sure to click the blue tick to confirm the new Liveboard and click Pin.
-
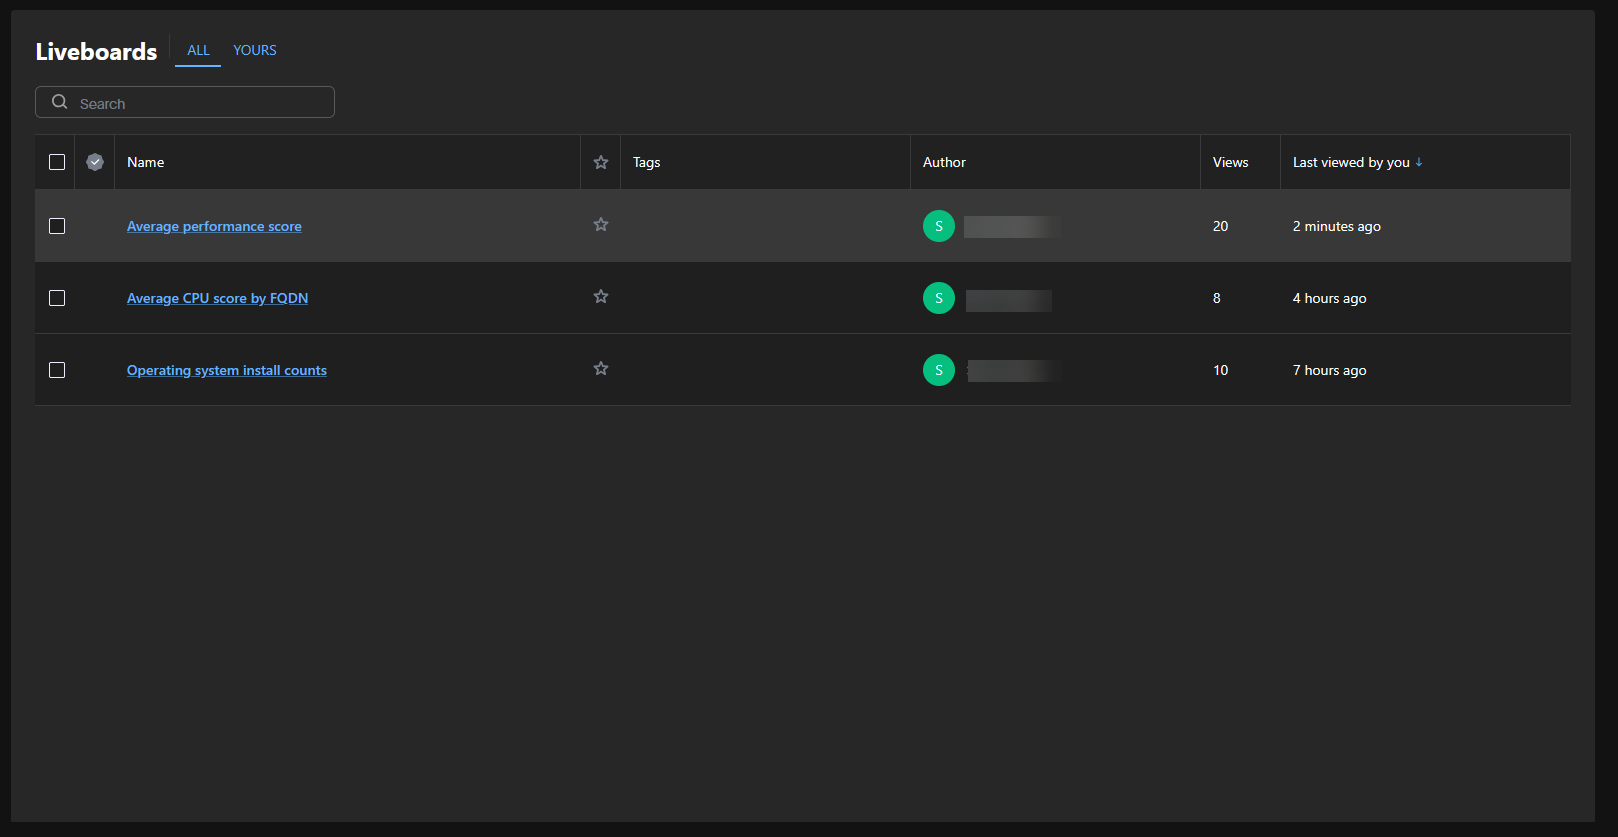
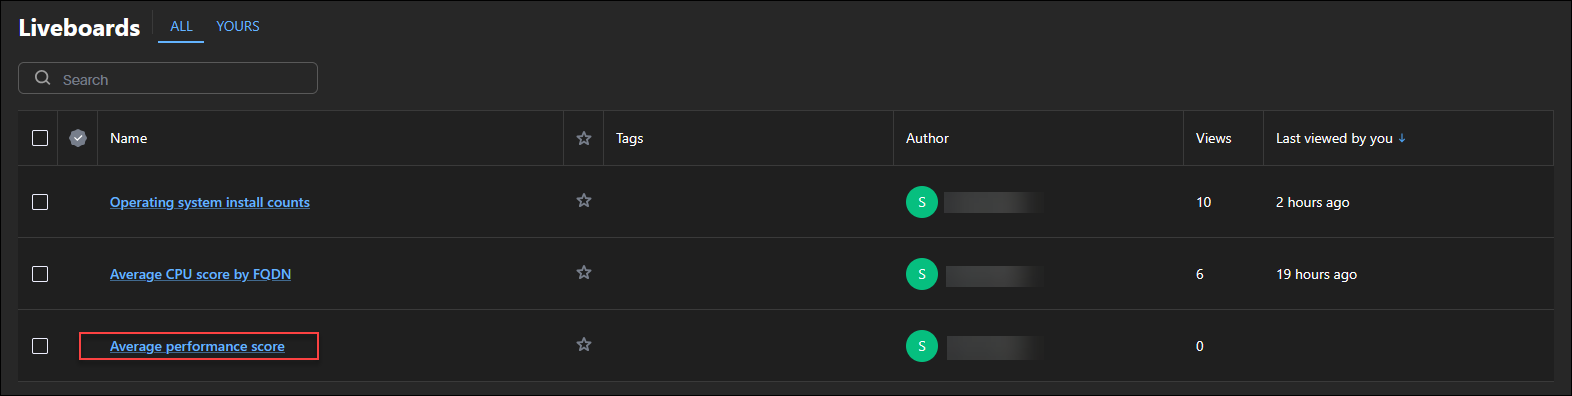
The new Average performance score Liveboard is now available from our Liveboards page.
Pinning existing reports to Liveboards
Liveboards are designed to complement how you work with your reports. There are two places where you can pin a report to a Liveboard.
-
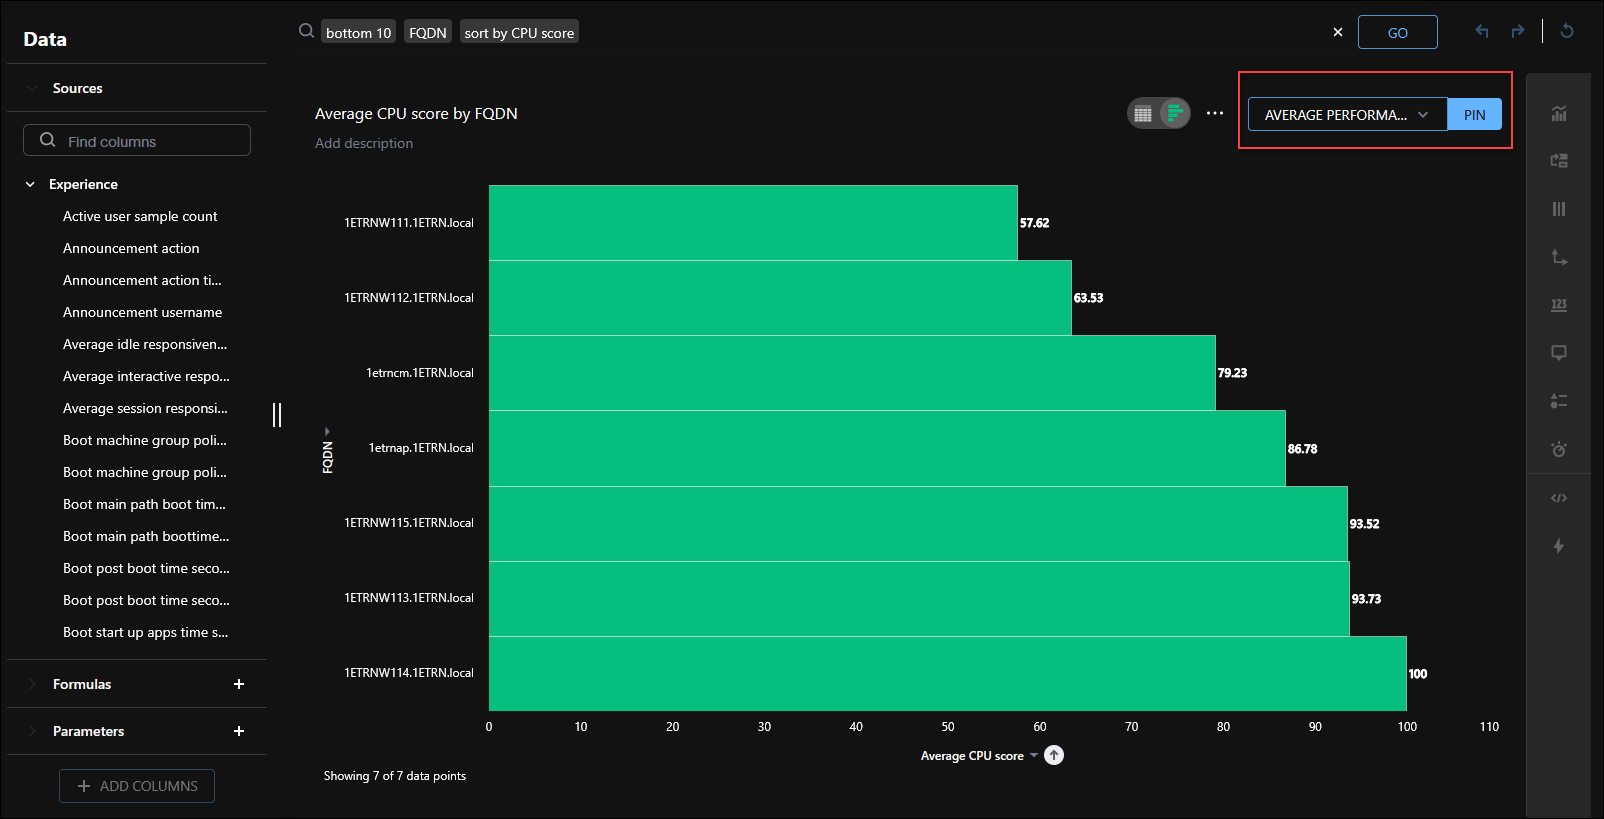
Tia reporting: After generating a report from a conversational prompt, select Pin to add the report to an existing Liveboard, or to create a new one.
-
Saved Reports: Previously saved reports can be added from the Saved Reports page using the Pin action. For information, refer to Saved reports.
Using Liveboards
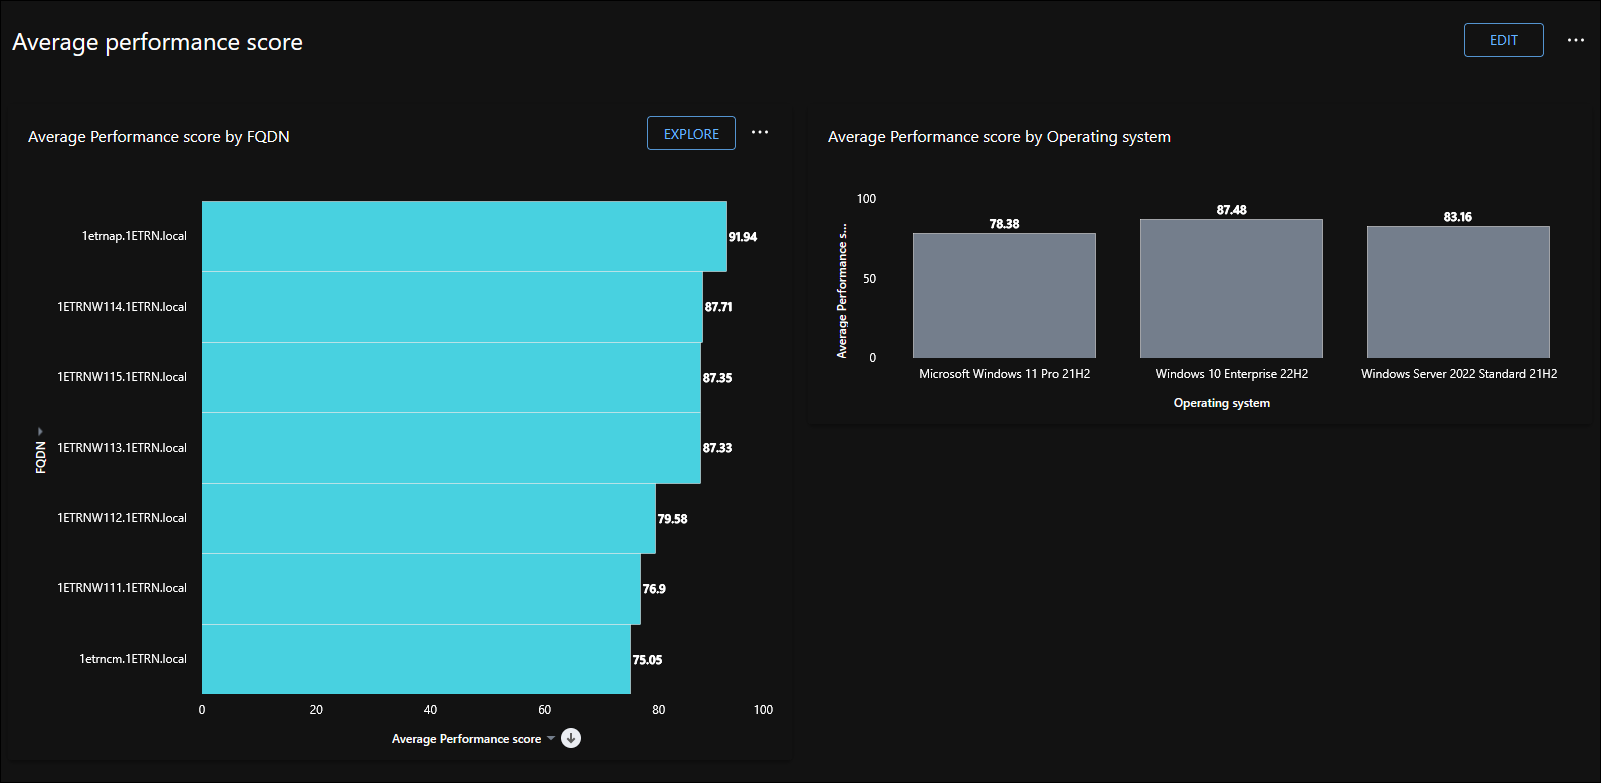
Opening a Liveboard reveals a dashboard made up of one or more reports where you can organize related information into a single view for ongoing monitoring and analysis.
Reports retain the same functionality as when viewed individually.
Exploring and editing Liveboards
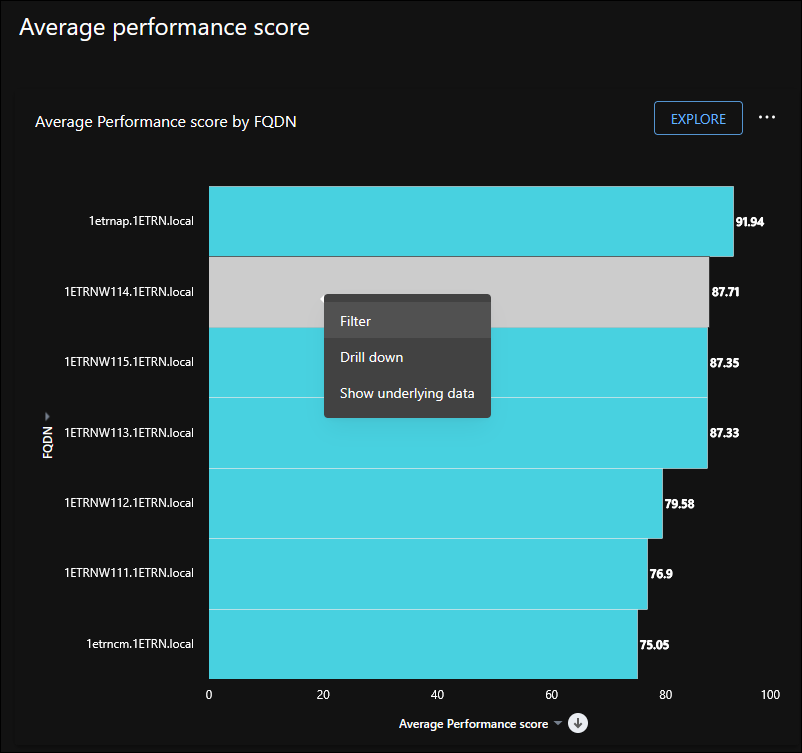
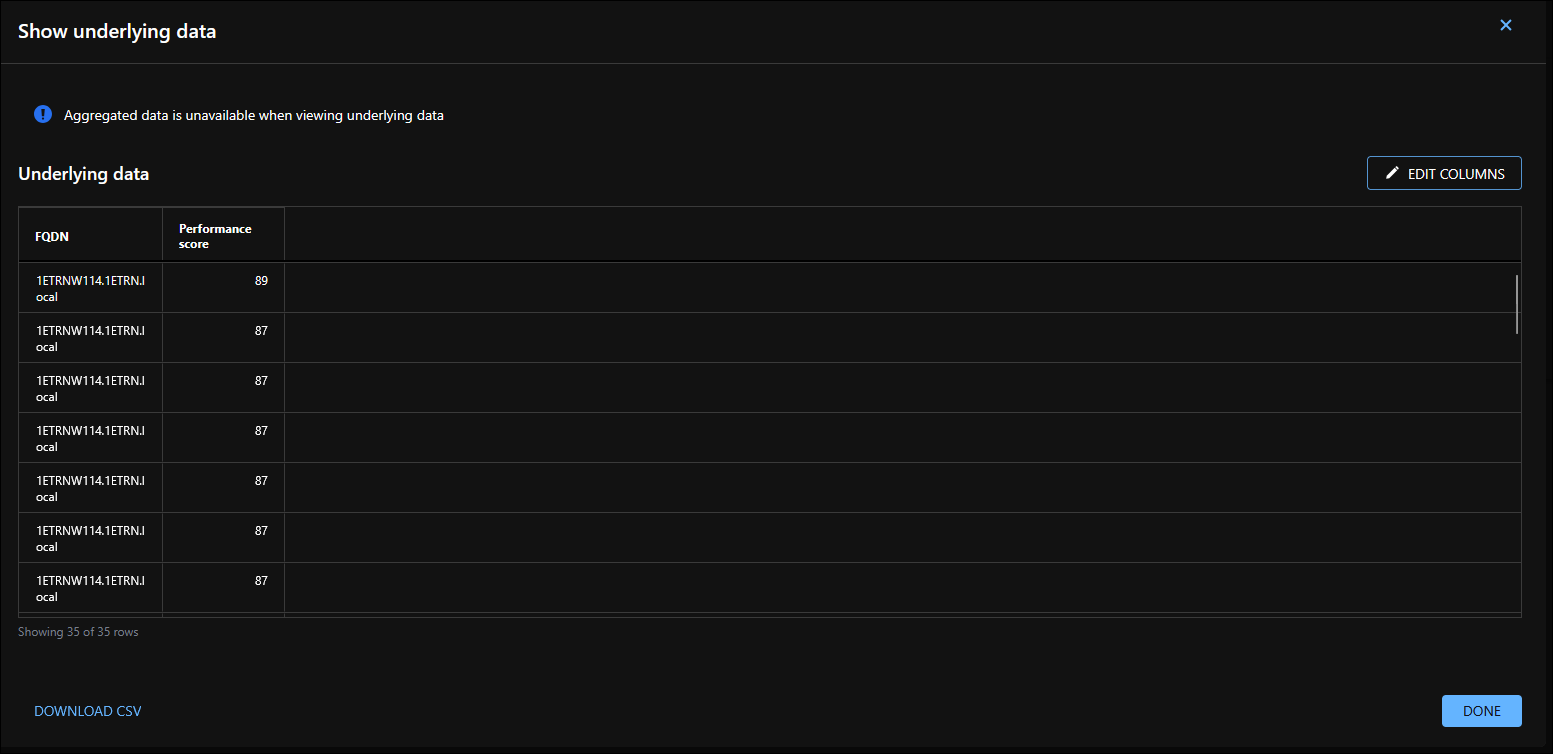
By right-clicking an element you can continue to investigate underlying data directly from a Liveboard using the Filter, Drill down, or Show underlying data options. The following example shows underlying data, which you can download as a CSV file.
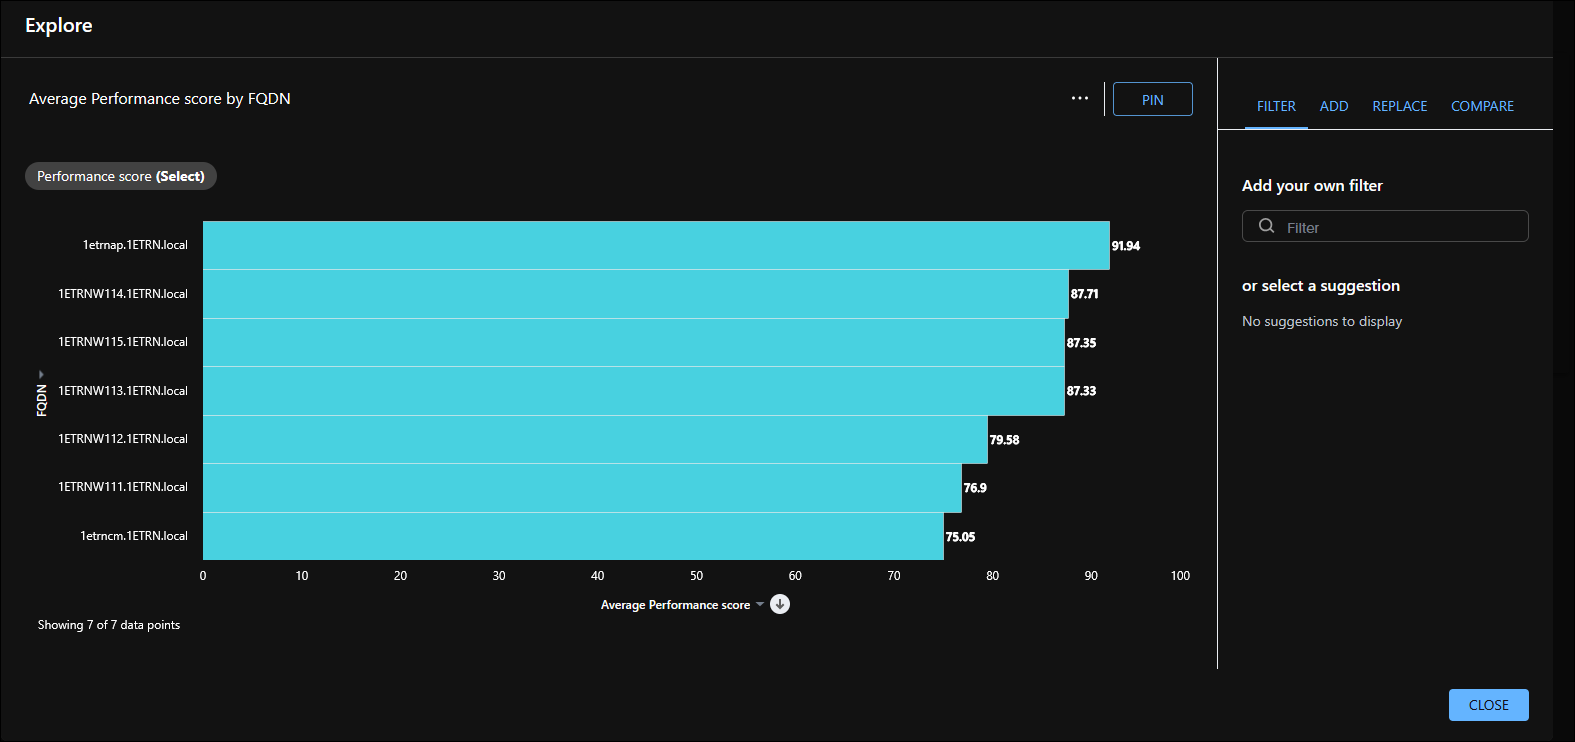
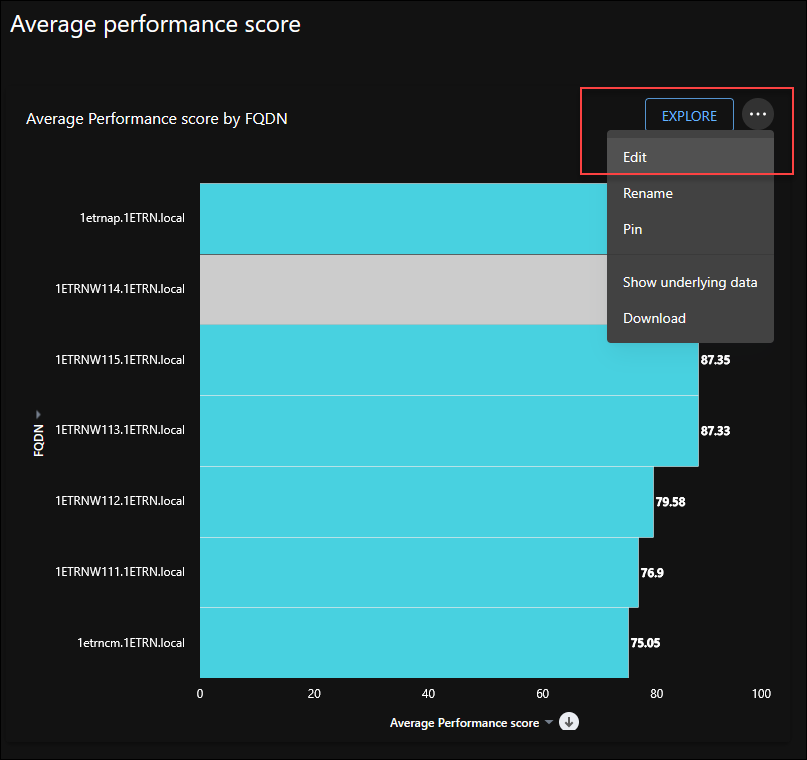
When you need additional analysis, the Explore option opens the report for deeper investigation while maintaining the current context.
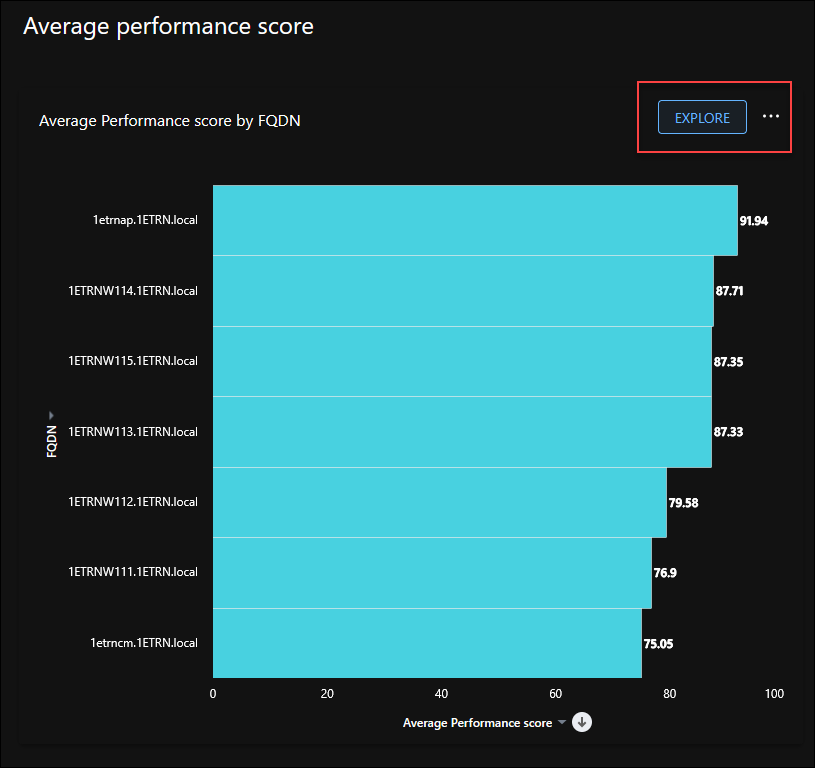
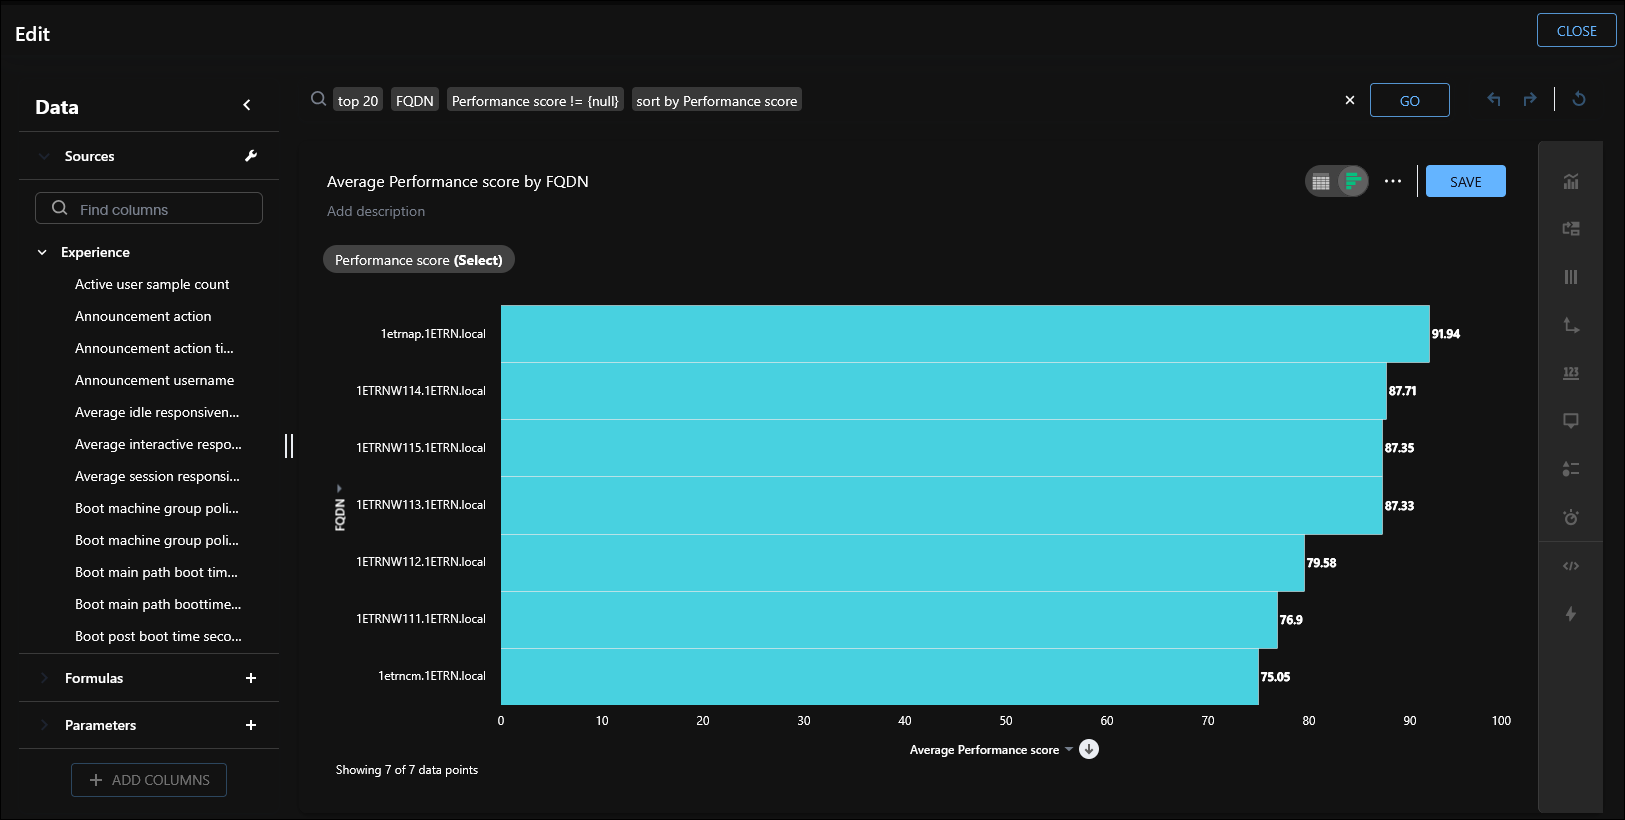
Reports can be edited from within a Liveboard. Click Edit from the Liveboard screen to refine visualizations without leaving the dashboard experience. For details about editing, refer to Editing an answer.
Editing Liveboard layouts
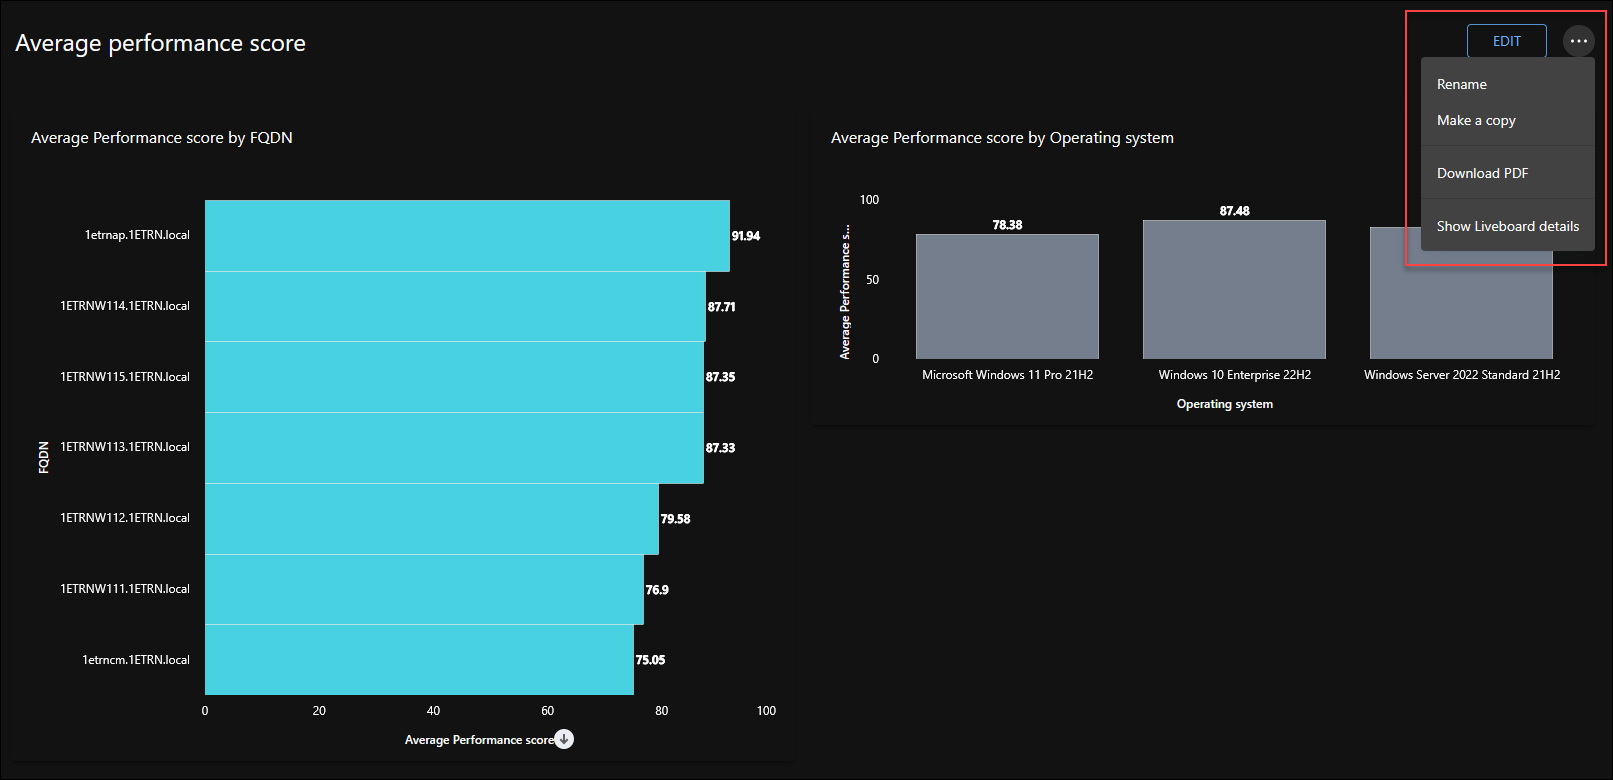
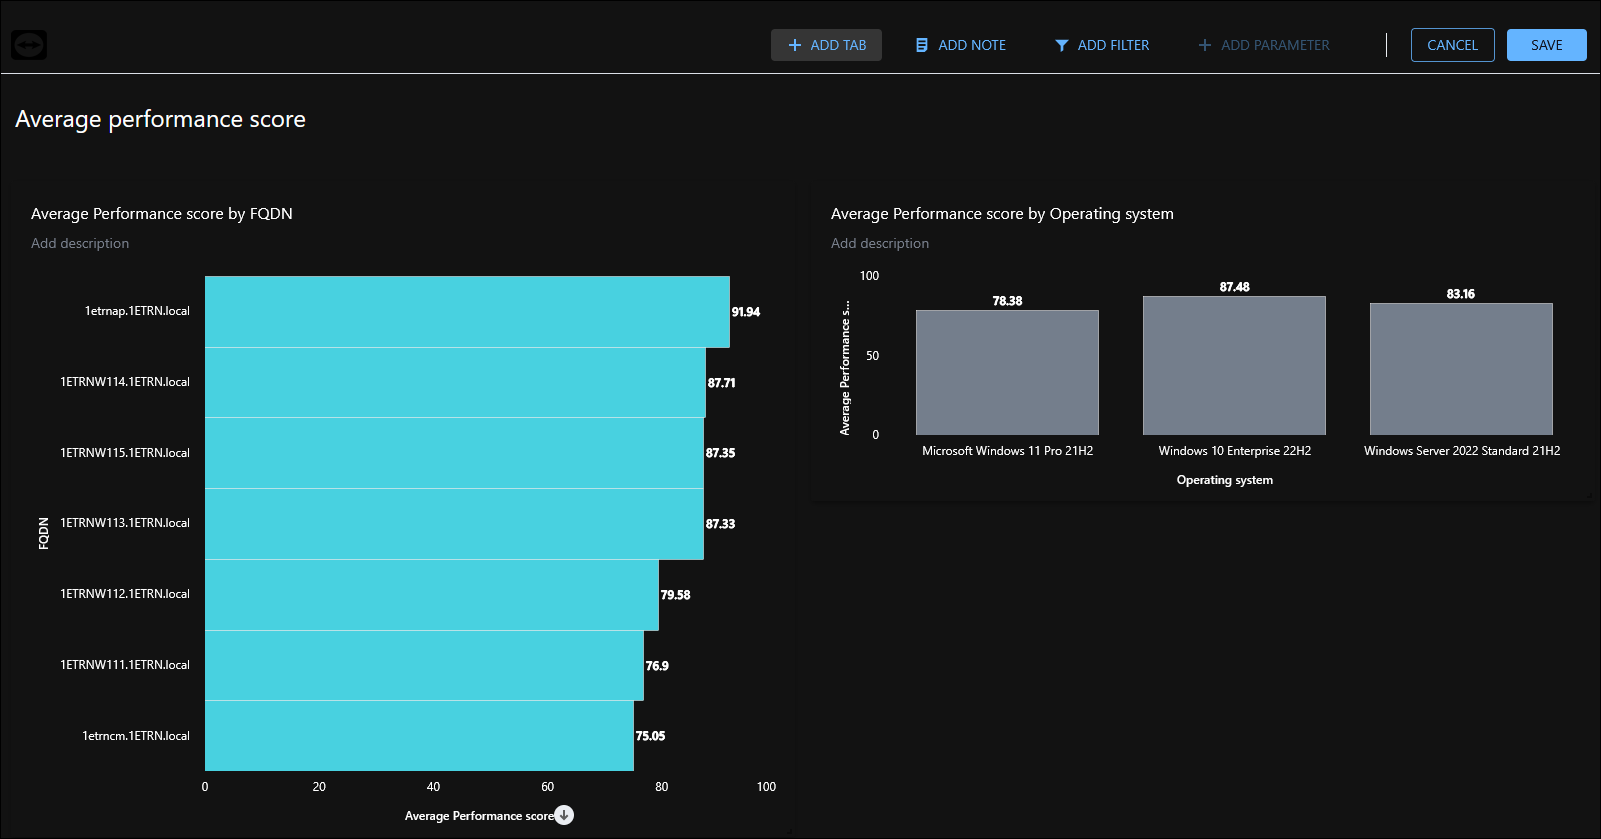
To edit a Liveboard layout, click Edit from the top-right corner of the board. You can also rename, make a copy, download, or show Liveboard details from here.
-
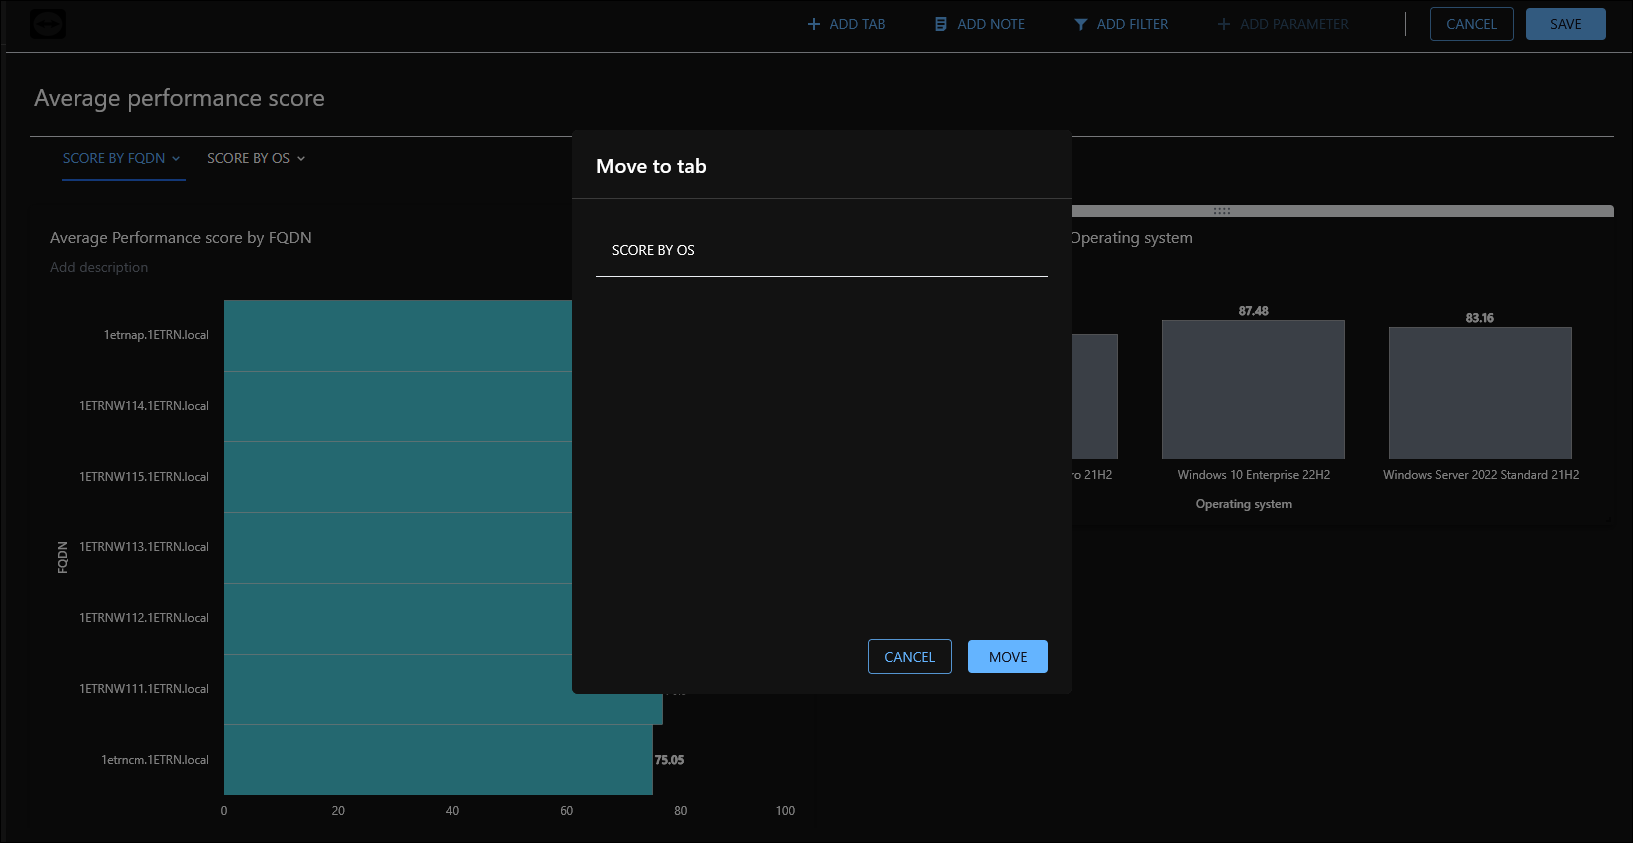
Add Tab: Add new, rename, or remove tabs. Once you have added a new tab, you will have the option to move a Liveboard report to it.
-
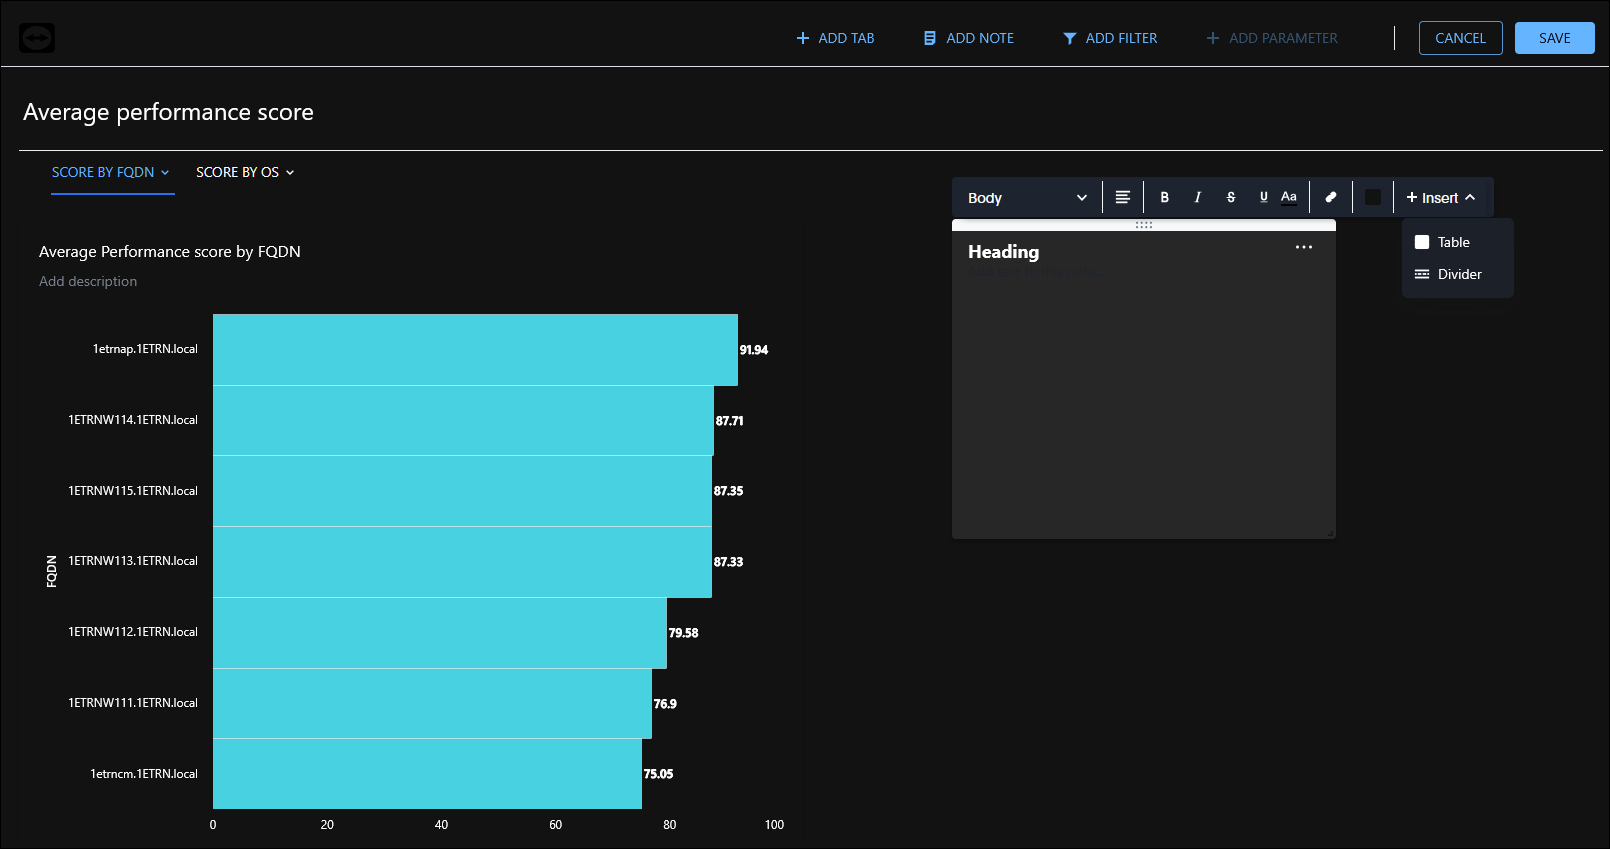
Add Note: Annotate your reports using the note feature. These can be edited, adjusted for size, and moved between tabs.
-
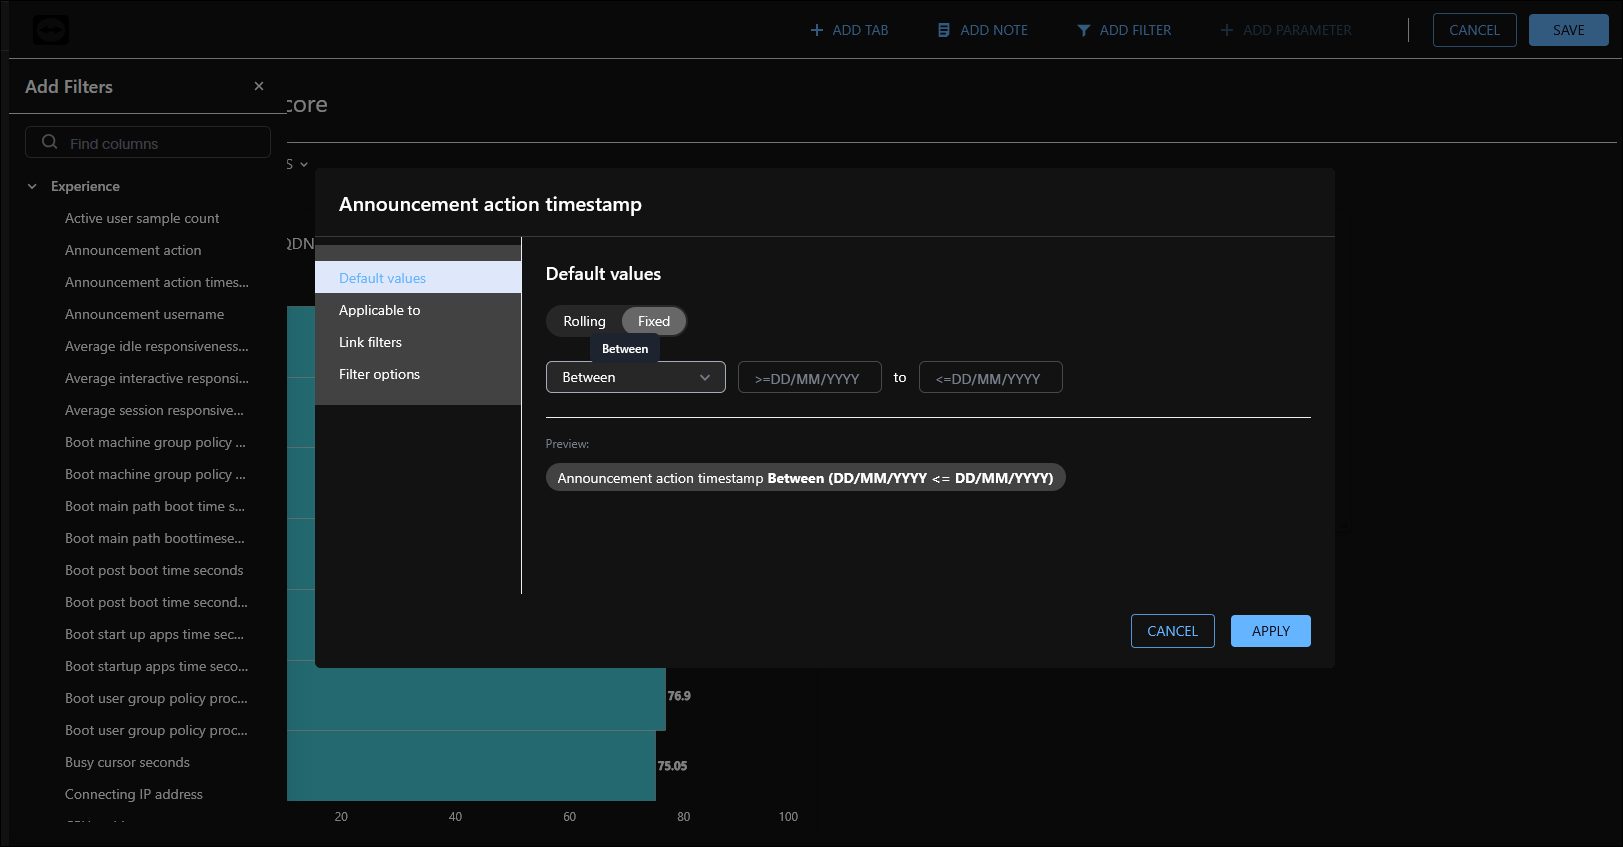
Add Filter: This section lets you filter your data source (Currently Experience Analytics). For more details, refer to Data.
-
Add Parameter: Only parameters used by charts on a Liveboard will be displayed. Parameters created at the answer level cannot be added at the Liveboard level.
-
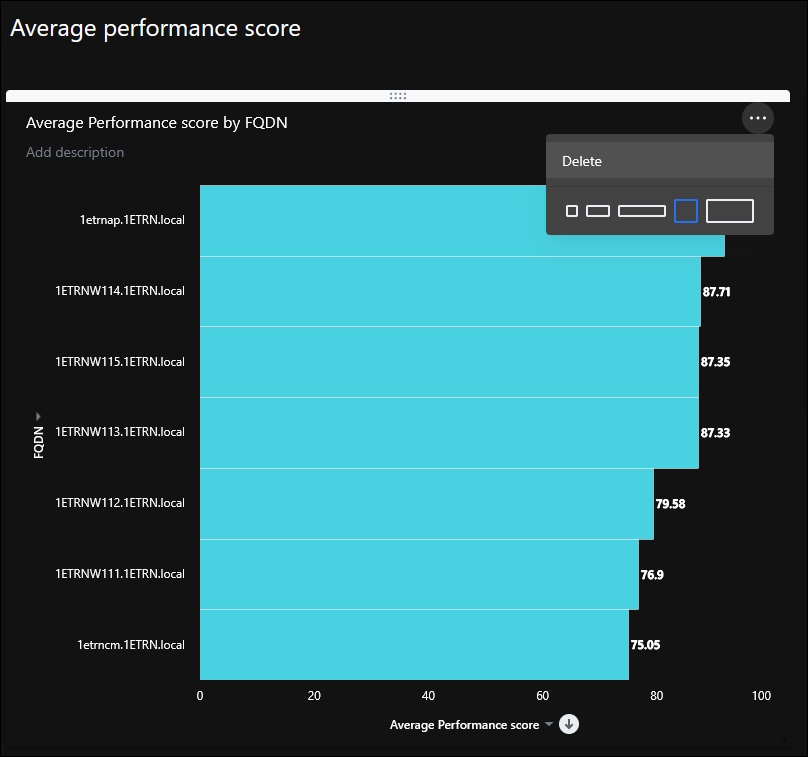
Delete, rescale or move your reports: Click the three dots to use these options. When you have more than one tab, the Move to tab is made available.
Example Liveboard
This video demonstrates Liveboards functionality and ease of use.