Devices page
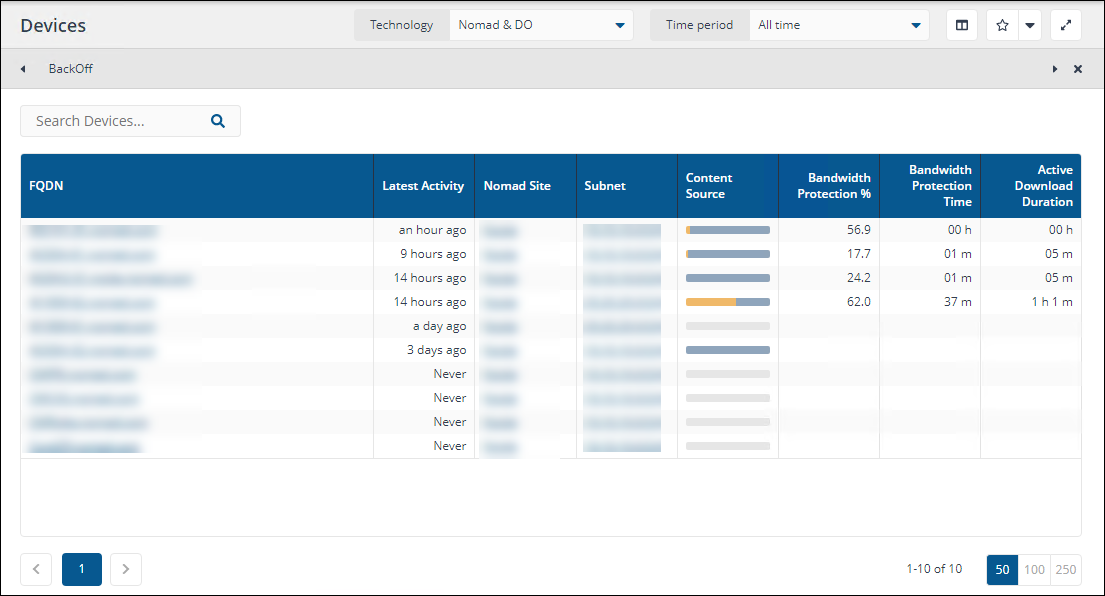
The Devices page in 1E Content Distribution displays all registered devices with Content Distribution download activity, including filters, activity status, and network metrics.
The product formerly referred to as Nomad has been rebranded as Content Distribution. Although the new name is implemented in the majority of documentation and user interfaces, references to Nomad may still appear in specific tools, scripts, or contexts.
Navigation and filtering
Devices are listed in order of Latest Activity, devices with the most recent activity are at the top of the list. The Time period filter is 'inherited' if it has been previously set on another page in the same browser session. If the Time period is set to All time, devices that have registered (i.e. they are running Content Distribution) but have not sent any download activity will appear at the bottom of the list and Latest Activity will show Never in the Latest Activity column.
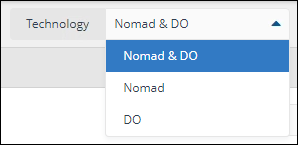
In addition to the Time period filter, you can use the Technology filter to show devices that have download activity from Content Distribution, Delivery Optimization (DO) or both (default).
The Devices list has the following columns.
|
Column |
Description |
|---|---|
|
FQDN |
Fully Qualified Domain Name. |
|
Latest Activity |
Indication of how long ago the latest download activity occurred on this device. |
|
Nomad Site |
The Nomad SSD Site that the device is currently in based on the last adapter registration event. |
|
Subnet |
The subnet that the device is currently in based on the last adapter registration event. |
|
Content Source |
A bar representing the volume of content this device has downloaded from a peer (in grey) vs from a source over the WAN (in orange). |
|
Bandwidth Protection % |
Bandwidth Protection shown as a percentage of downloads. This is the result of the Bandwidth Protection Time column dived by the Active Download Duration and multiplied by 100. |
|
Bandwidth Protection Time |
Duration the client backed off from downloading to save download bandwidth. 1E Content Distribution slows down downloads when needed to keep enough bandwidth available for important business tasks. This helps prevent it from using too much bandwidth and disrupting normal work. This metric is not visible by default, you can select it usingSelect Columns. |
|
Active Download Duration |
Duration for which client actively downloaded the content, this excludes interruptions while downloading, for example because of network issues. This metric is not visible by default, you can select it using Select Columns. |
Technology filter
You can use the Technology filter to differentiate between downloads through Nomad or Delivery Optimization (DO).
The following options are available:
-
Nomad & DO (Default)
-
Nomad
-
DO
If this filter is applied to any app page, it is reflected on all other pages in the Content Distribution App.
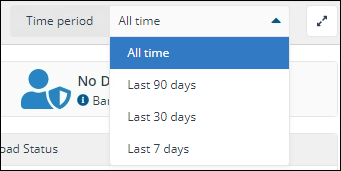
Time period filter
Using the Time periodfilter at the top of the page, you can narrow down the results by date. You can choose from the following options:
-
Last 90 days
-
Last 30 days (Default)
-
Last 7 days
If these filters are applied to any app page, it is reflected on all other pages in the Nomad App.
Select Columns
-
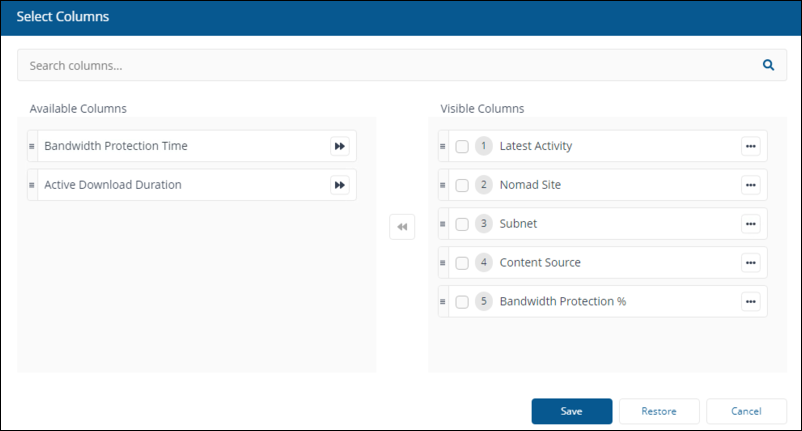
Select columns by clicking on the Select Columns option. You can add, remove or re-order the columns in the Visible Columns section.
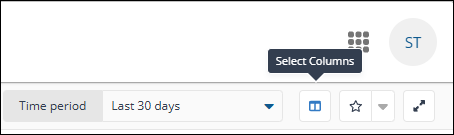
-
When you click on the Select columns control, it opens a pop-up displaying every column on the current screen, the controls are:
-
Available Columns: Columns, which are by default hidden from display on screen. You can still include any of them to display on screen
-
Visible Columns: Displays the list of columns displayed on screen
-
Arrow buttons: To move up or move down, exclude or include any column, clicking on the ellipsis displays these additional controls
-
Drag and drop: You can drag and drop columns to change how they are displayed
-
Exclude columns: Exclude column allows you to select columns to exclude from the current display
-
-
Clicking Save on the Select Columns screen saves the layout for the current browser session.
-
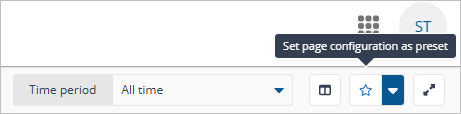
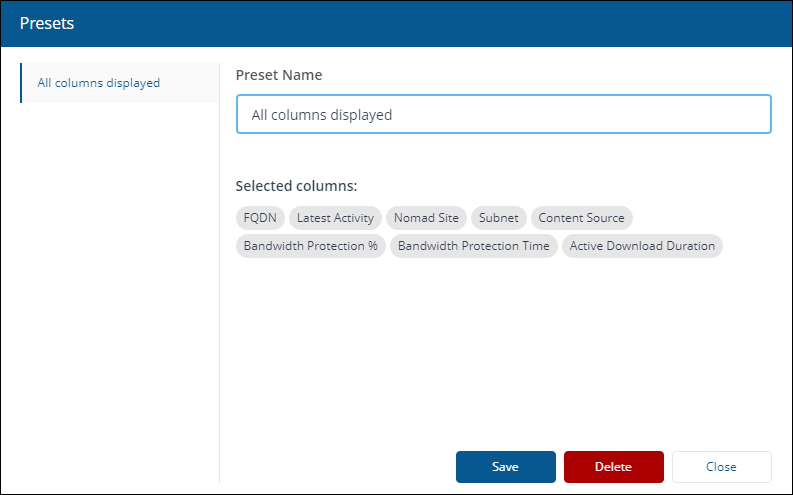
Set page configuration as preset, if you have amended the displayed columns using the Choose columns control, you can then save the view as a preset which will be available later.
-
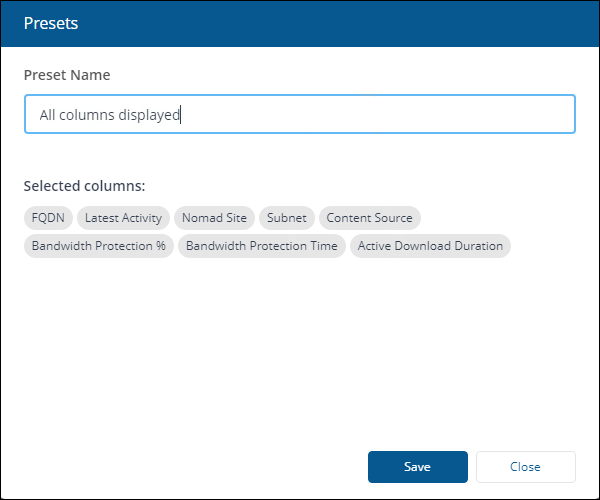
Clicking Set page configuration as preset displays the Presets popup. Here, you can give the view a name, in the shown example this is called All columns displayed as we have chosen to display every available column.
-
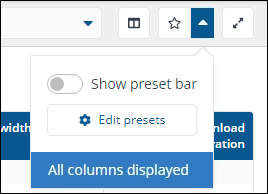
Once saved, you can select your saved views using the Manage/Apply Presets control or edit them by clicking Edit presets.
Search
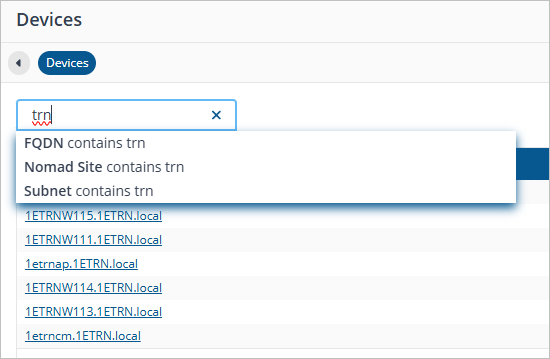
You can use the Search Devices box to search for a specific device by FQDN, Network Site or Subnet.
When you start typing into the search box, a list will appear as indicated below, allowing you to select which column (FQDN, Network Site or Subnet) that the search term should be applied to.
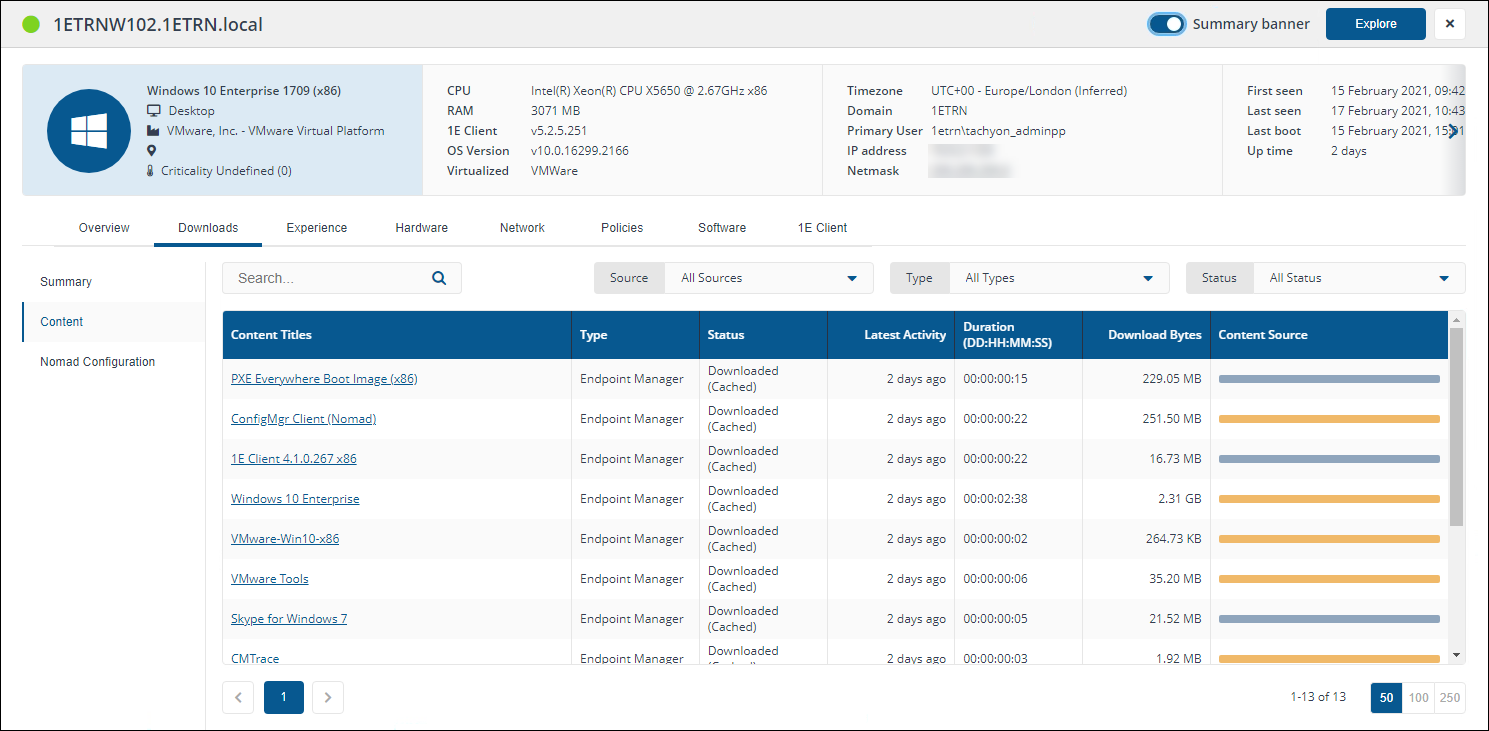
The Device view Downloads tab
The Device view is a common view used throughout the platform to present details of a device from multiple 1E Platform applications.
The default view in the Devices view is Downloads. The remaining tabs display information corresponding to an app, feature or data set implemented in 1E, other tabs are visible if an app has been installed and licensed, and the user has permissions to use the app, refer to Additional Device View tabs for detail. Clicking on one of the links in the FQDN column of the Devices page displays the Device view for the selected device. The aim of the Device view is to provide a combined overview of all the information known about a device, along with the ability to retrieve information about the device in real-time. When displaying the Device view from a page, the view defaults to the Downloads tab. The Downloads tab contains information derived from and useful for using Content Distribution.
In addition, the Summary banner displays a quick summary of the information provided in the various tabs displayed in the Device View. It can be viewed by toggling the Summary banner switch to on, refer to Summary banner for details.
The Time period filter does not apply to detail pages. As a result, if you have set theTime periodfilter on theDevices page to, for example,Last 7 days, you may see different results on the detail page for a device.
The details shown on the Downloads and other tabs rely on access to the associated app, but also Instruction Sets used by the 1E Platform. To view details in the Downloads tab for the app you'll need to load the 1E Nomad product pack. For more details, refer to Setting up the Content Distribution app.
Downloads tab
TheDownloadstab has three items.
The Downloads tab presents download activity and status for the device. Whenever you click on an FQDN on any of the Content Distribution dashboard pages, the Device details page will be displayed with the Downloads tab selected.
Summary
Summary has four panels.
-
Status bar
-
Bandwidth Usage Per Day by Content Source (UTC)
-
P2P Efficiency by Content Source
-
Content Titles Count by Content Type
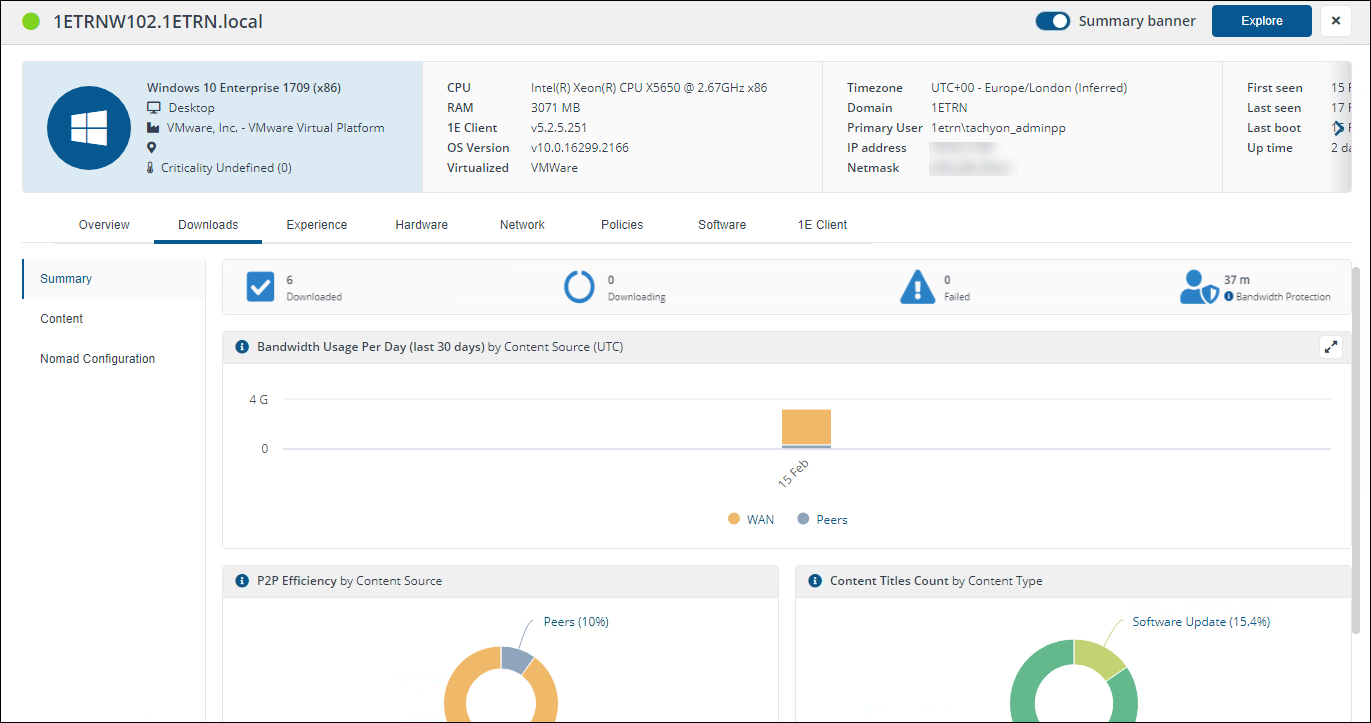
Status bar
The status bar along the top shows high-level download statistics for this device.
|
Column |
Description |
|---|---|
|
Downloaded |
Number of completed downloads on this device. |
|
Downloading |
Number of downloads that are actively in progress on this device. |
|
Failed |
Number of downloads on devices that are currently in the site, whose latest status is failed. |
|
Bandwidth Protection |
Bandwidth Protection allows Content Distribution to adjust the speed of ongoing downloads to save bandwidth for other business use. Bandwidth Protection ensures Content Distribution doesn't consume excess bandwidth and hinder other business activity. |
Clicking on any of these icons will navigate to theContentview of theDevice detailtab, filtered according to the clicked icon.

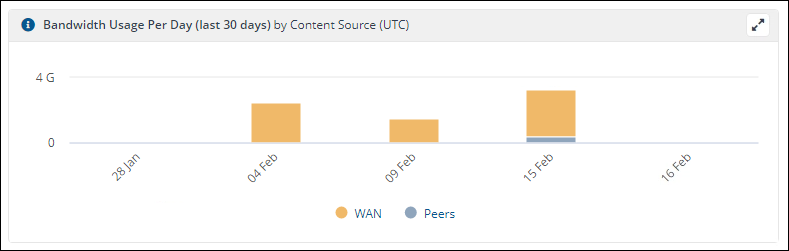
Bandwidth Usage Per Day by Content Source (UTC)
The Bandwidth Usage Per Day by Content Source (UTC) tile represents daily download activity on this device for the last 30 days. A column is displayed for each day when there was download activity. Each column indicates the volume of content that was downloaded over the WAN (in orange) or from peers (in grey).
Hovering over a segment of the column displays the volume of content downloaded on that day, demonstrating the value that Nomad and Delivery Optimization are providing through reduced WAN traffic. If the majority of content is being downloaded over the WAN, it could indicate that peers are simply not available (e.g. this device is being used from home) or it could be an indication that Nomad or Delivery Optimization are not correctly configured to optimize content from peers.
The columns on this chart are not clickable - they are for data visualization only and do not navigate to another view of the data.
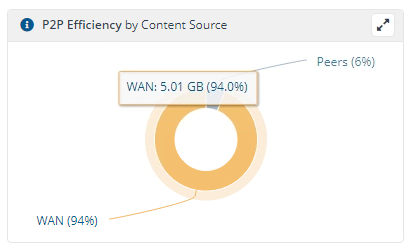
P2P Efficiency by Content Source
The P2P Efficiency by Content Source tile represents the overall peer-to-peer efficiency across the entire network for the selected Content Title. The data is grouped by source (Peers and WAN) and displayed as a donut chart showing the volume of content downloaded from peers (in grey) and from the source over the WAN (in orange).
Ideally, more content will be downloaded from peers than from the source over the WAN, thereby saving network bandwidth. Where this is not the case, it could be due to many users working remotely without any local peers, or it could be due to configuration settings on the client that are not optimized for peer-to-peer caching and availability. It may also be worth considering pre-caching the Content Title in more locations to improve the availability of the content on peers in each location.
Clicking either segment in this chart will navigate to the Devices tab filtered to show the devices that downloaded the selected Content Title from Peers or WAN, according to the segment that you clicked on.
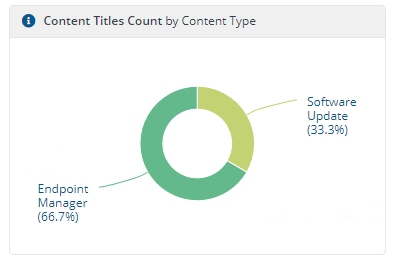
Content Titles Count by Content Type
The Content Title Count by Content Type tile shows the total number of unique Content Titles where there is download activity reported for the latest version of the content within the site. The data is grouped by Content Type and displayed as a donut chart.
The app currently reports on two Content Types:
-
Endpoint Manager: In this release this includes CM Applications and Packages
-
Software Updates: Includes any Microsoft Software Updates deployed through CM or Windows Update.
Hovering over a Content Type segment of the chart displays the count of Content Titles of that type, also represented as a percentage of all Content Titles.
Clicking on a Content Type segment of the chart will navigate to the Content tab, filtered to show Content Titles of the selected segment.
Content
The Content panel shows the status of content downloaded on the device.
|
Column |
Description |
|---|---|
|
Content Titles |
Content title, for:
|
|
Type |
Currently, either Endpoint Manager or Software Update. |
|
Status |
Current status of the content on this device. This can include the following statuses.
|
|
Latest Activity |
Date and time of the latest event for the content title on this device. |
|
Duration |
The time taken to download the content. |
|
Download Bytes |
Amount of bytes of the content actually downloaded by the device. In some cases, especially with Software Updates, only deltas or byte ranges will be downloaded rather than the entire source content. |
|
Content Source |
A bar indicating the proportion of the content that was downloaded over the WAN or from peers. |
The Time period filter does not apply to detail pages. As a result, if you have set the Time period filter on the Devices page to, for example, Last 7 days, you may see different results on the detail page for a device.
Navigation and filtering
There are four ways you can filter viewable content.

Search
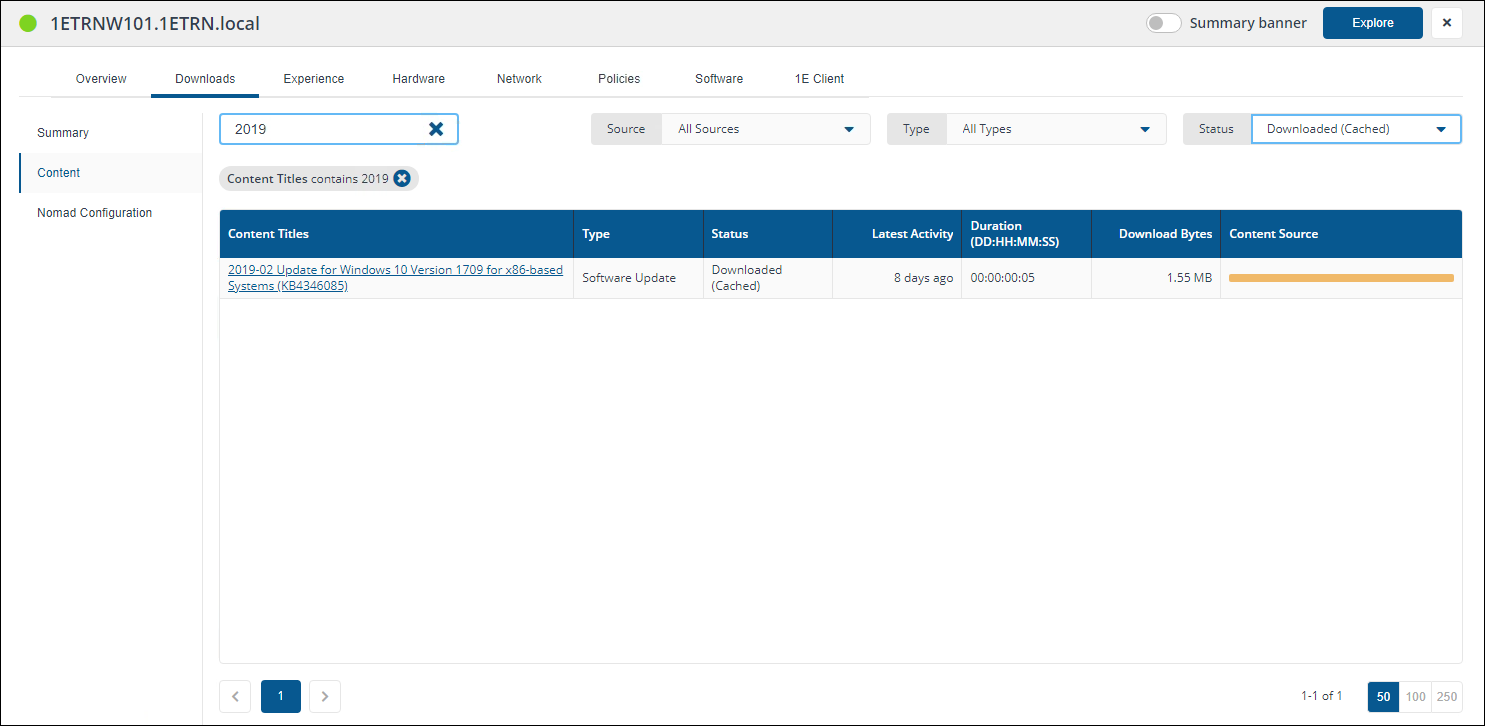
Use the search box at the top left of the page to filter by specific criteria, for example in the picture the default view has been filtered by Content Titles containing 2019 in their title.
Navigating away from this view resets the table to its default view.
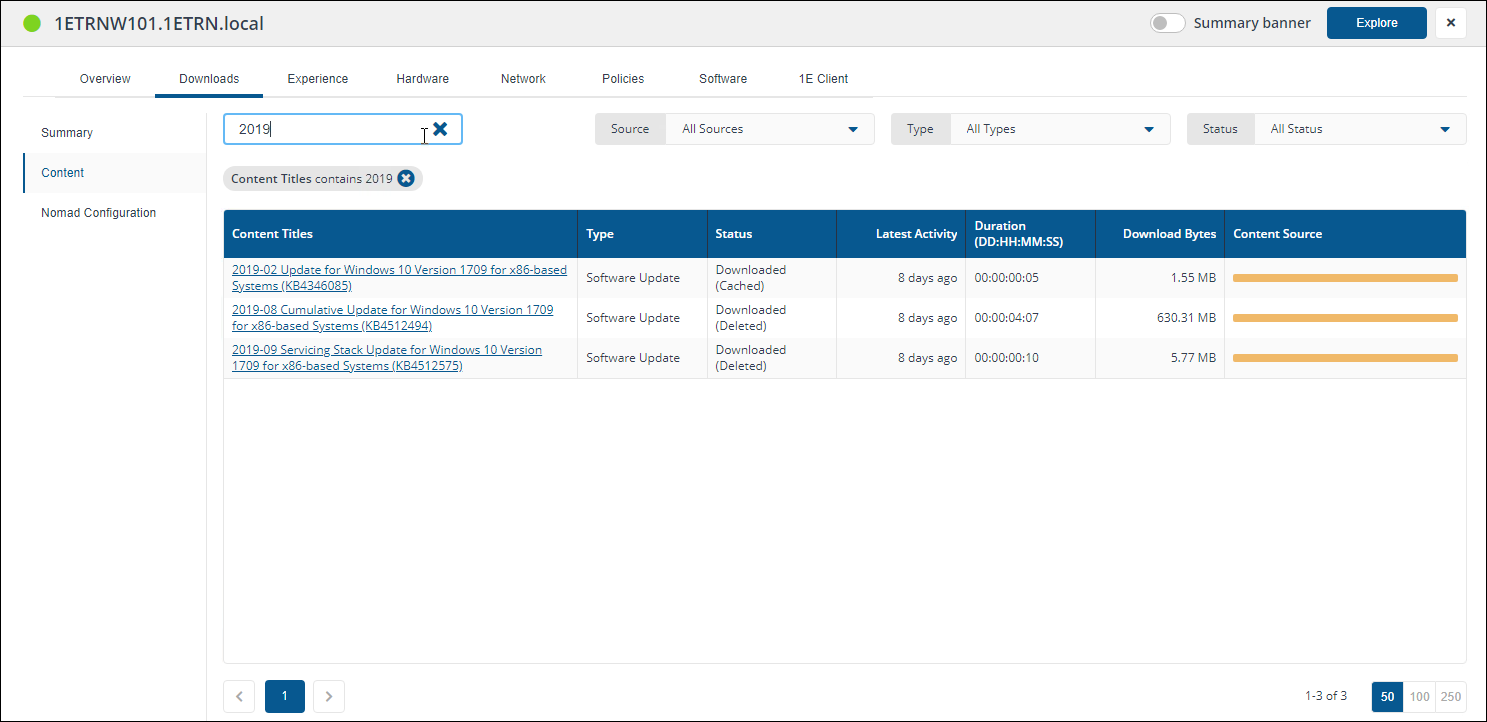
Filters
Filter the table using these options.
|
Filter |
Options |
Description |
|---|---|---|
|
Source |
|
Shows content that was downloaded from either the WAN or peers. |
|
Type |
|
Shows Endpoint Manager and Software Update content. |
|
Status |
|
Shows all content for which any download activity has been reported. |
|
Management Group |
Autocomplete text entry |
Filters the devices grid by the Management Group that devices belong to. Start typing a name to search for and select a Management Group. Management Groups are available as a filter only and are not displayed as a column on the devices grid or in the column picker. |
Content Distribution Configuration
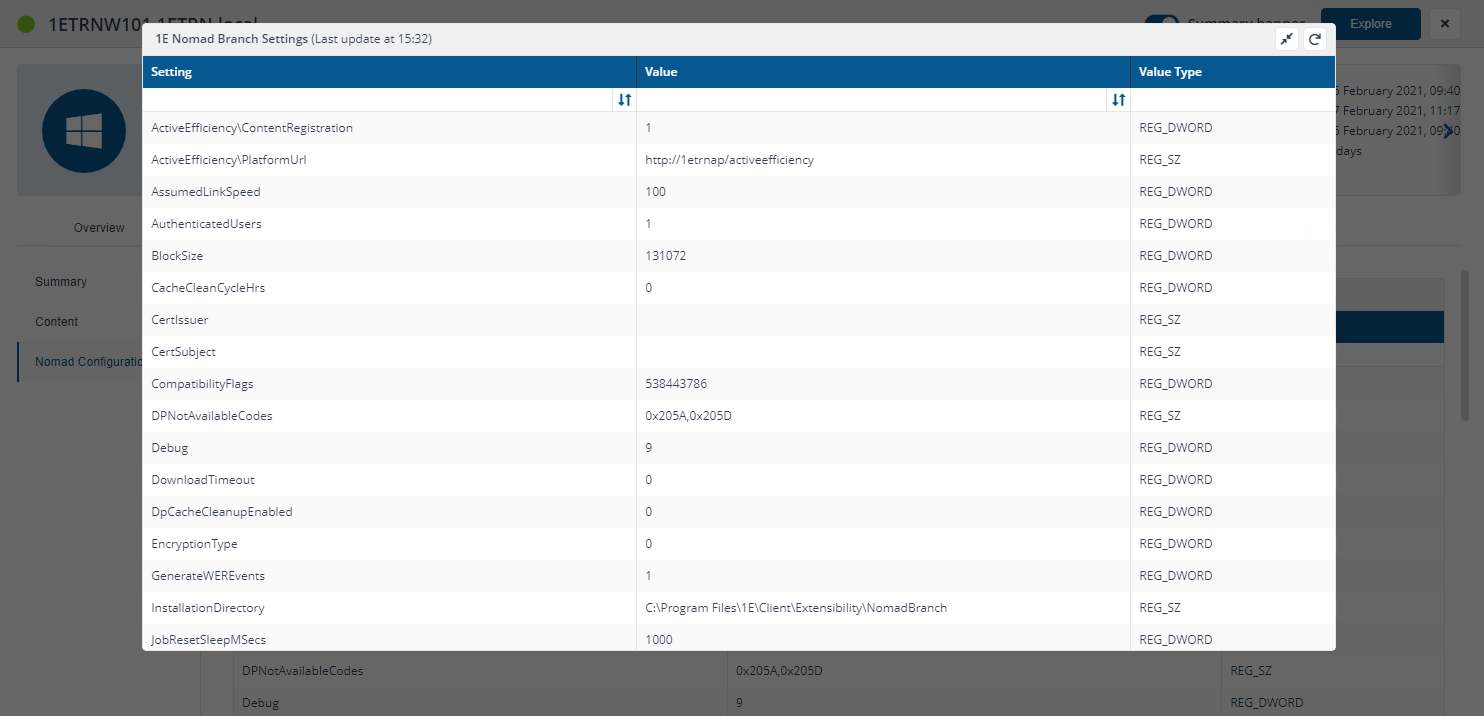
Shows the 1E Nomad Branch Settings for the selected device. You can use this to check a device's registry entries if the device is not behaving as expected.
Classic product pack used to create the 1E Nomad instruction set in the platform, required by the following features.
-
Downloads tab on Device views: Instructions used to populate details about Content download and other Content Distribution features
-
Download Pause: Instructions used by the CM Admin Console extensions
-
Instructions to help with the following features: Content Distribution Cache, Cache management, Single Site Download, Content Distribution jobs, NomadBranch.exe command-line switches
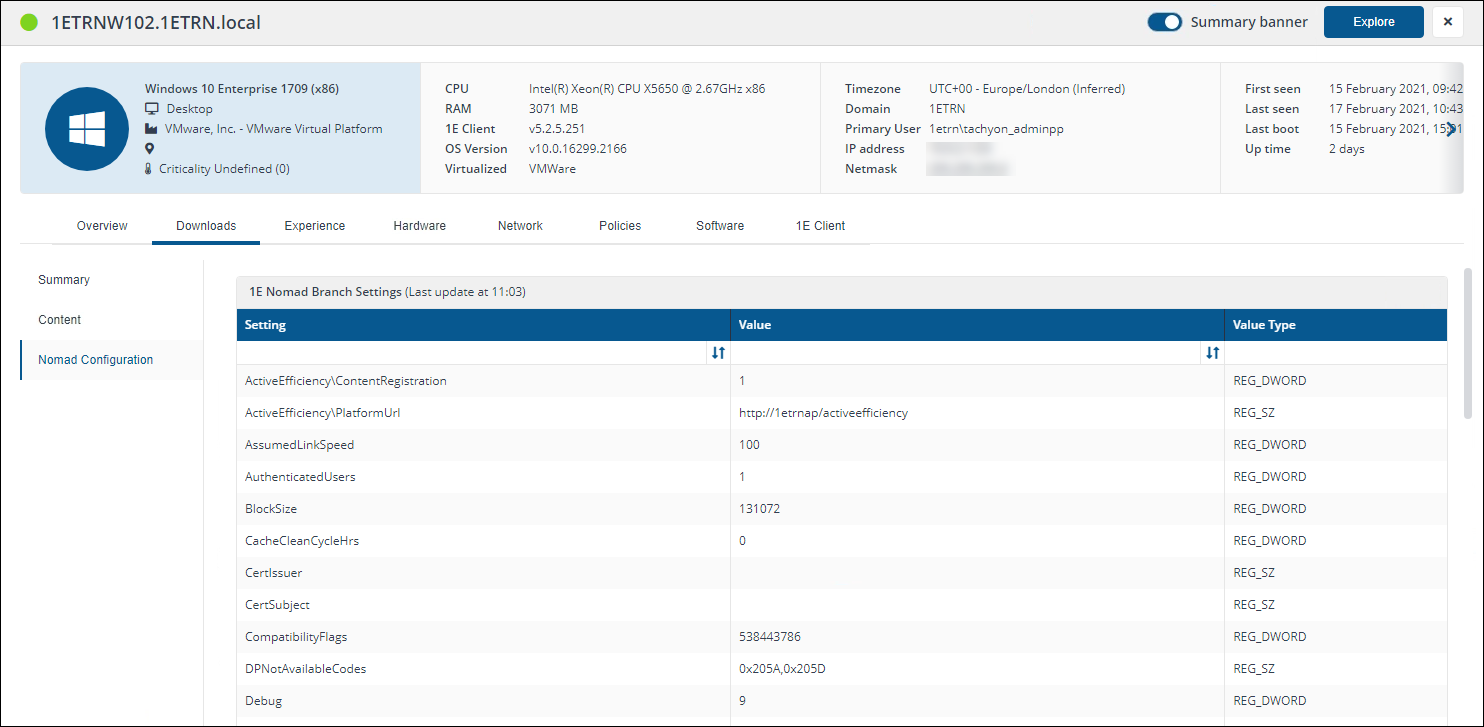
The 1E Nomad Branch Settings panel is expandable. Moving your mouse over the panel reveals an Expand on the top left of the panel and a refresh option. Clicking refresh, re-runs the 1E-Nomad-NomadBranchSettings instruction.
A full list of Content Distribution registry values by feature are available on the Content Distribution registry values page. Registry values for NomadBranch are located in HKLM\Software\1E\NomadBranch
Summary banner
The Summary banner displays a quick summary of the information provided in the various tabs displayed in the Device View. It can be viewed by toggling the Summary banner switch to on. For a breakdown of the Summary banner, refer to Summary banner.
Additional Device View tabs
In addition to the Downloads tab, there are a series of tabs, each corresponding to an app, feature or data set implemented in the Platform. The Overview and 1E Client tabs are always present in the Device View. Other tabs are visible if an app has been installed and is licensed.
Each tab has one or more panels with tiles populated with data from various sources, some by instructions that are run instantly, with results cached for 3 minutes. An appropriate error message is displayed instead of a tile in the following circumstances:
-
If the device is offline, as indicated by the color of the icon in the top left
-
The user does not have at least Viewer permission to view use the license the tab or panel
-
The user does not have questioner permission to run the instruction
-
An instruction has not been uploaded
The Device View tabs and panels page lists the names of tabs and their panels, and a description of each tile indicating how the tile is populated.