Device View
Explore the Device View to access a centralized, real-time overview of endpoint health, performance, inventory, and management information from a single interface. This reference explains the available device details, status indicators, actions, and insights that help administrators troubleshoot issues, monitor endpoint health, and manage devices more efficiently.
The Device View is a shared page accessible from many applications.
The Device View for modules migrated to the new UI has changed, refer to Inventory insights Devices
The Overview and 1E Client tabs are always present in the Device View. Other tabs are visible if an app has been installed and is licensed.
Each tab has one or more panels with tiles populated with data from various sources, some by instructions that are run instantly, with results cached for 3 minutes. An appropriate error message is displayed instead of a tile in the following circumstances:
-
If the device is offline, as indicated by the color of the icon in the top left.
-
The user does not have at least Viewer permission to view use the license the tab or panel.
-
The user does not have questioner permission to run the instruction.
-
An instruction has not been uploaded.
The Device View tabs and panels page lists the names of tabs and their panels, and a description of each tile indicating how the tile is populated.
The Device View is a common view used in multiple apps to present device details. The aim of the Device view is to provide a combined overview of all the information known about a device along with the ability to retrieve information about the device in real-time. Each application displays a different default tab (see below), other tabs are visible if an application has been installed and licensed, and the user has permission to use the application.
|
Platform application |
Device page |
Device page default tab |
Device view |
|---|---|---|---|
|
Clicking on one of the links in the FQDN column of the Experience Analytics Devices page displays the Device view for the selected device. When displaying the Device view from a Experience Analytics page the view defaults to the Experience tab. The Experience tab contains information derived from and useful for Experience Analytics. |
|
||
|
Clicking on the information icon next to the device name in the Device Name column of the Devices Table page displays the Device view for the selected device. When displaying the Device view from the Endpoint Troubleshooting Devices Table page, the view defaults to the Overview tab. |
|
||
|
Clicking on one of the links in the Device Name column of the Endpoint Troubleshooting Devices page displays the Device view for the selected device. When displaying the Device view from a Endpoint Troubleshooting page the view defaults to the Policies tab. The Policies tab contains information derived from and useful for using Endpoint Troubleshooting. |
|
||
|
Clicking on one of the links in the FQDN column of the Content Distribution Devices page displays the Device view for the selected device. The default view in the Content Distribution devices view is Downloads. |
|
The Summary banner displays a quick summary of the information provided in the various tabs displayed in the Device View. It can be viewed by toggling the Summary banner switch to on.
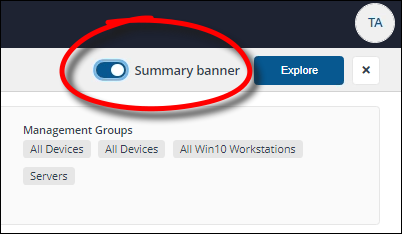
The following picture shows the Summary banner displayed for a particular device.

Summary banner panels
The following table describes the information provided in the Summary banner, and shows details equivalent to the following tiles.
|
Panel |
Tab |
Panel |
Column |
Tile |
Description |
Example |
Data source |
|---|---|---|---|---|---|---|---|
|
|
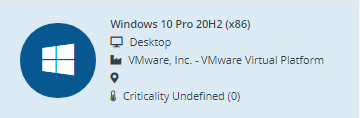
Overview |
Details |
Hardware and Operating System |
Operating System |
Version |
Windows 10 Pro 20H2 (x86) |
Data from 1E Master (the latest online status message) |
|
Hardware and Operating System |
Hardware |
Device Type |
Desktop |
|
|
|
|
|
Hardware and Operating System |
Hardware |
Manufacturer |
VMware, Inc |
|
|
|
|
|
Hardware and Operating System |
Hardware |
Model |
VMWare Virtual Platform |
|
|
|
|
|
Identification |
Location |
Location |
|
|
|
|
|
|
Identification |
Identification |
Criticality |
Undefined (0) |
|
|
|
|
|
|
Overview |
Details |
Hardware and Operating System |
Hardware |
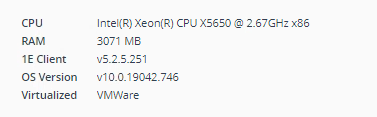
CPU Type |
Intel(R) Xeon(R) CPU X5650 @2.67GHz x86 |
|
|
Hardware and Operating System |
Hardware |
RAM |
3071 MB |
|
|
|
|
|
Identification |
Identification |
1E Client |
v5.2.5.251 |
|
|
|
|
|
Hardware and Operating System |
Operating System |
Version |
v10.0.19042.746 |
|
|
|
|
|
Hardware and Operating System |
Operating System |
Virtual/Physical |
VMWare |
|
|
|
|
|
|
Overview |
Details |
Identification |
Location |
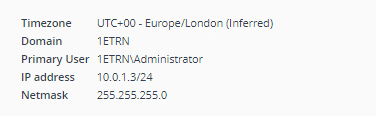
Timezone |
UTC+00 - Europe/London (Inferred) |
|
|
Identification |
Identification |
Domain |
1ETRN |
|
|
|
|
|
Connectivity and Activity |
Activity |
Primary User |
1ETRN\Administrator |
|
|
|
|
|
Connectivity and Activity |
Connectivity |
Local IP Address |
10.0.1.3/24 |
|
|
|
|
|
|
|
|
|
Netmask |
255.255.255.0 |
|
|
|
|
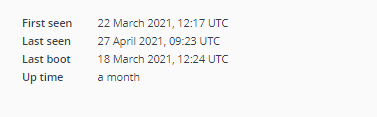
Overview |
Details |
Connectivity and Activity |
Connectivity |
First Connected |
22 March 2021, 12:17 UTC |
|
|
Connectivity and Activity |
Connectivity |
Last Connected |
27 April 2021, 09:23 UTC |
|
|
|
|
|
Connectivity and Activity |
Activity |
Last Boot |
18 March 2021, 12:24 UTC |
|
|
|
|
|
|
|
|
|
Up time |
a month |
|
|
|
|
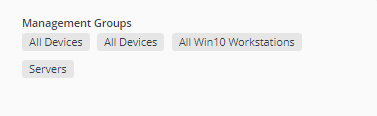
Overview |
Details |
Identification |
Grouping |
Mgmt. Groups |
|
|
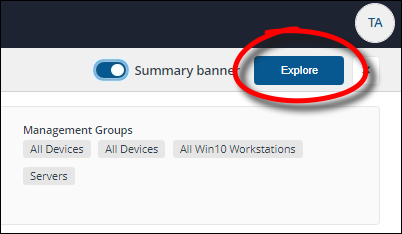
You can click on Explore in the Device View to launch Endpoint Troubleshooting with the current device set as the scope.
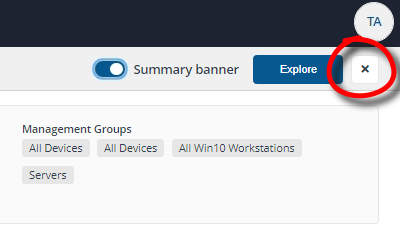
The Device View is a popup that is displayed when clicking on the name of a device on a page where devices are displayed. To return to the page you came from you need to click the x.
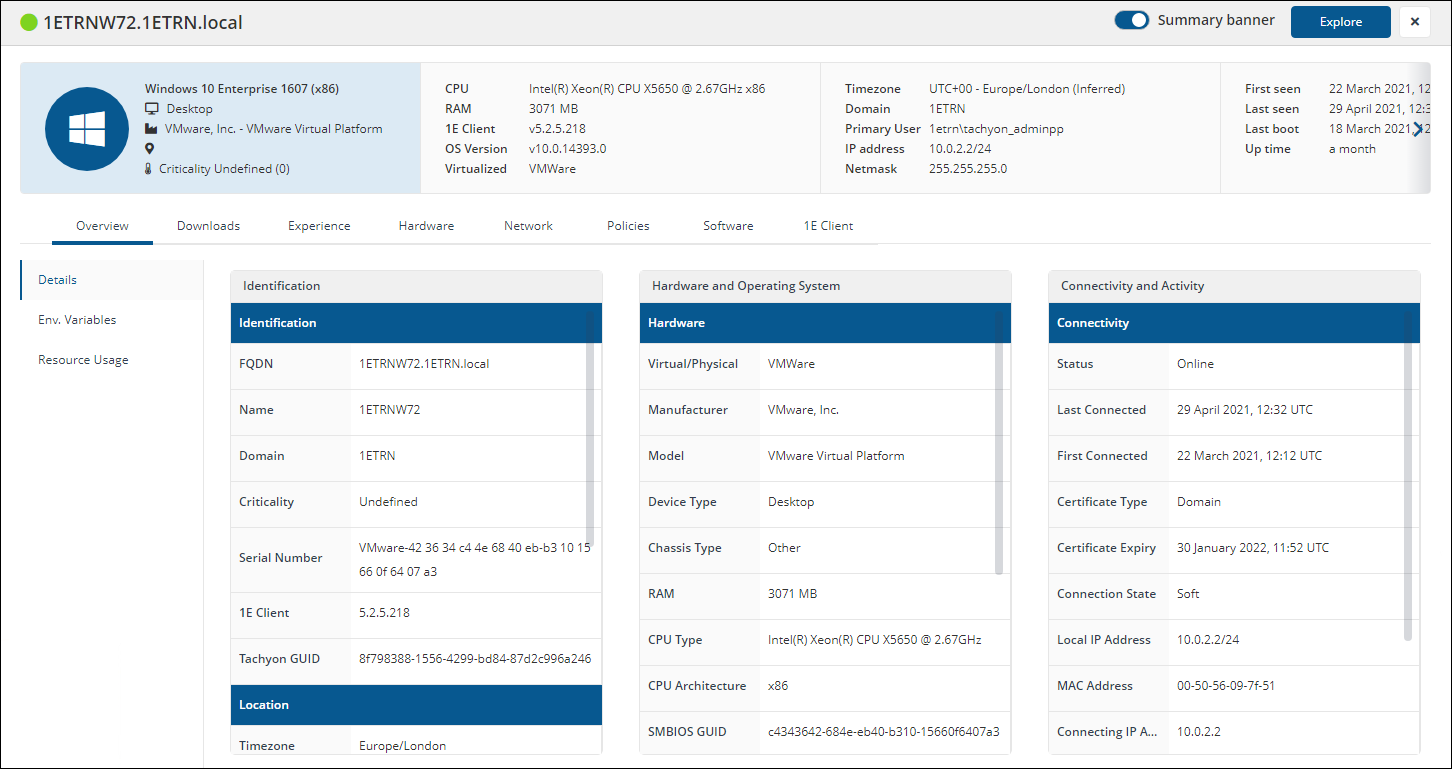
Overview tab
Displays a number of tiles sorted into Identification, Hardware and Operating System and Connectivity and Activity columns that show information for the selected device retrieved from the online status information stored in the 1EMaster database.
|
Panel |
Column |
Title |
Description |
Data source |
|---|---|---|---|---|
|
Details
|
Identification
|
Identification |
Display's the current device:
|
Data from 1E Master (the latest online status message) |
|
Location |
Displays the device's:
|
|
||
|
Grouping |
Displays the device:
|
|
||
|
Hardware and Operating System
|
Hardware |
Shows hardware details for the device:
|
|
|
|
Operating System |
Shows operating system, type and version for example:
|
|
||
|
Connectivity and Activity
|
Connectivity |
Shows current device connectivity status:
|
|
|
|
Activity |
Shows Last Boot date and time, Last Logged In User and current user. |
|
||
|
Environment Variables |
|
Shows a list of the environment variables set on the device. |
|
|
|
Resource Usage |
|
Two panels:
|
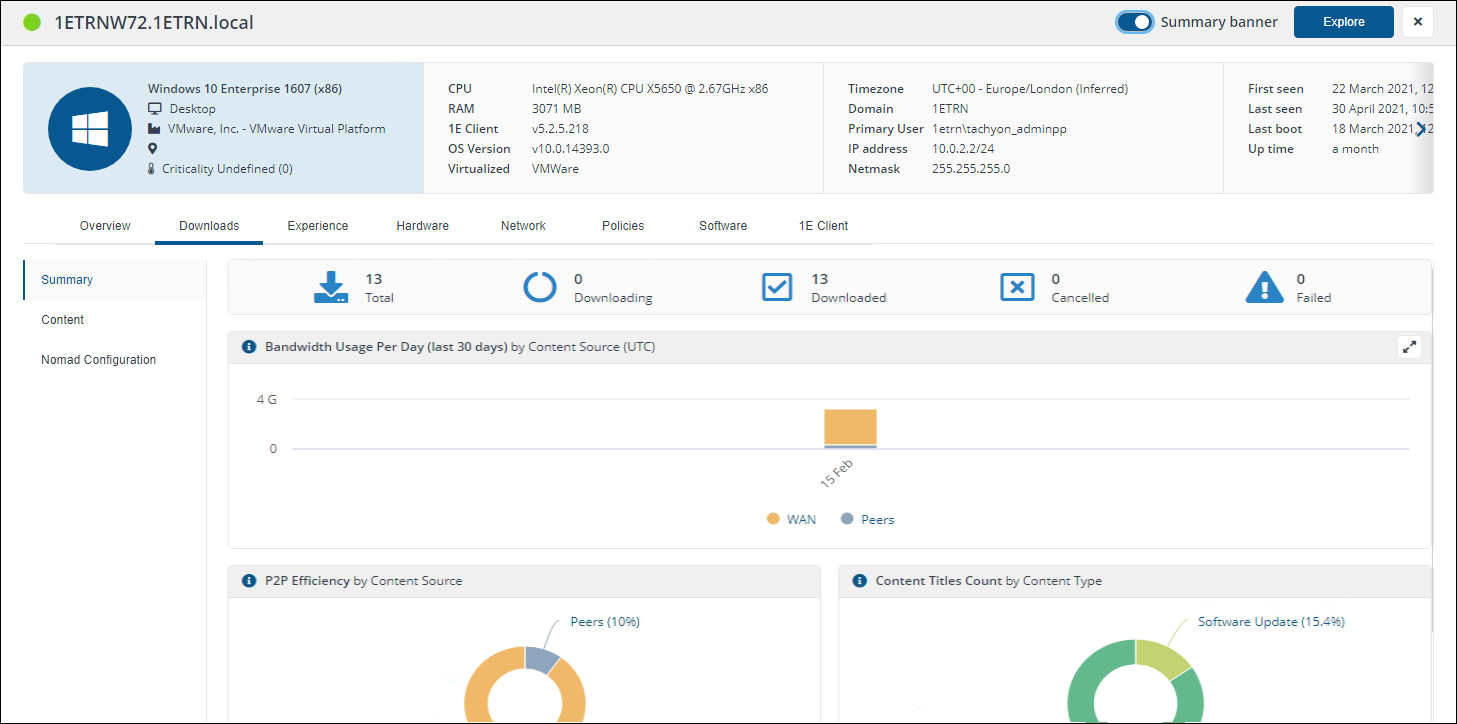
Downloads tab
|
Panel |
Description |
Data source |
|---|---|---|
|
Summary |
Download activity and status for the device. Whenever you click on an FQDN on any of the Nomad pages then the Device View will be displayed with the Downloads tab selected. |
Data from Content Distribution. |
|
Content |
Shows the details of the Content on the selected device.
You may see a difference in the number of items in a device’s Nomad cache versus that displayed in the Content Distribution app Device View. This is because if downloaded content has been deleted from Configuration Manager, the content titles cannot be resolved in the Content Distribution app and are not displayed. This is under consideration for re-design and may be revised in future versions of Content Distribution. |
Data from Content Distribution. |
|
Nomad Configuration |
Shows all the registry settings for the Nomad Branch service. |
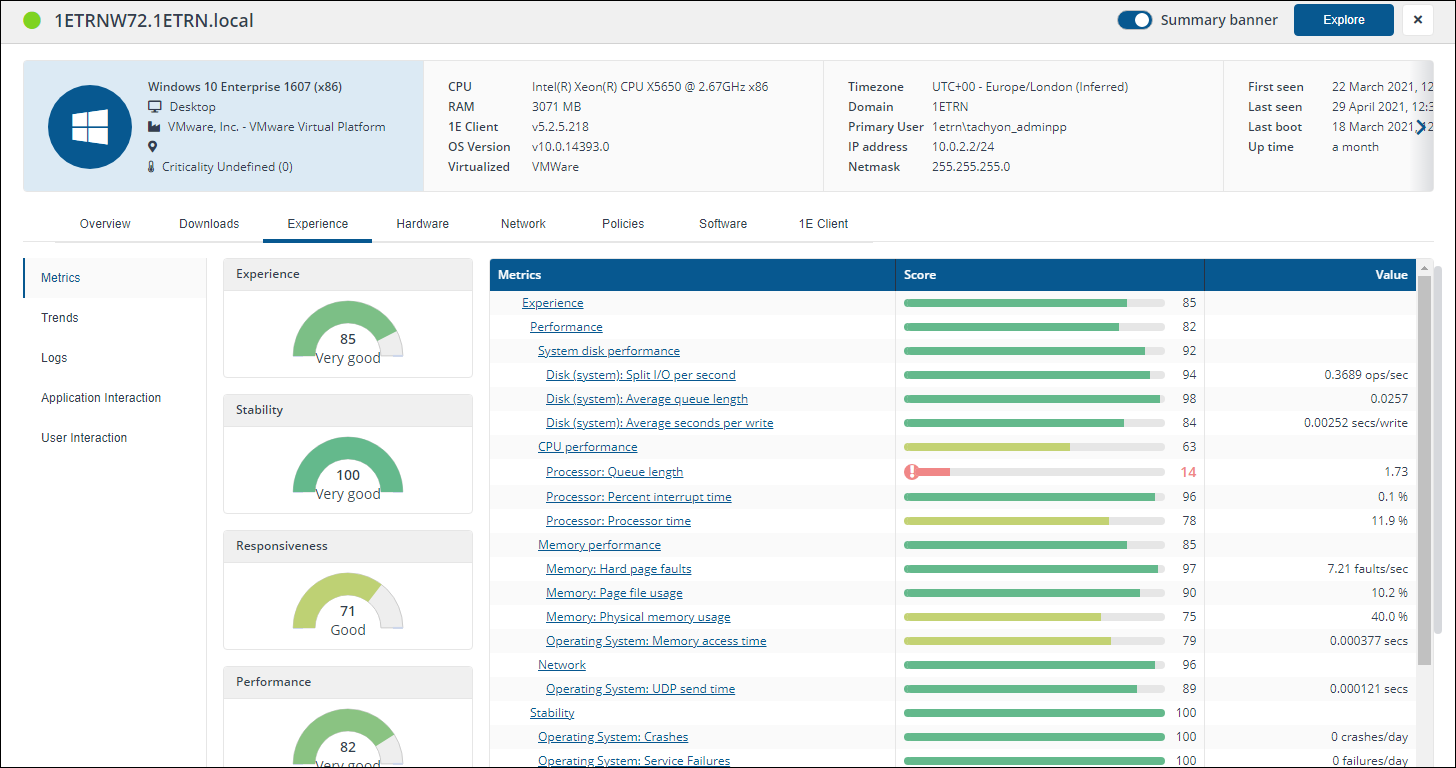
Experience tab
|
Panel |
Description |
Data source |
|---|---|---|
|
Metrics |
Metrics are the data points that are collected by the 1E Client and sent to the Platform. They are collected at different intervals depending on the type of data that is being collected. |
Data from Experience metrics |
|
Trends |
The Trends tab shows the changes in the scores over time. Hovering over the chart shows the details for that time and event. The user has the ability to select the metrics and events as per the requirement. They can move the required metrics from available to visible to see the trend charts. |
Data from Experience metrics |
|
Logs |
The Event Logs tab gives you a listing of the Windows Event log entries for that device. This brings that data to this view and is very useful when determining the root cause of an issue that has been reported on the device. |
Data from Experience metrics |
|
Application Interactions |
Shows user interaction times and ratios across applications measured over the last 30 days | |
|
User interactions |
Shows user interactive sessions with activity over last 30 days. |
Hardware tab
|
Panel |
Description |
Data source |
|---|---|---|
|
Disk drives |
Shows disk drives, including hardware and usage information.
|
|
|
Peripherals |
Shows the list of plug and play hardware devices (Windows only).
|
Network tab
|
Panel |
Description |
Data source |
|---|---|---|
|
Throughput |
Shows network throughput on all adapters for the last hour, represented by the following tiles:
|
|
|
Interface configuration |
Returns the output from the native network interface configuration command (e.g. ipconfig or ifconfig). |
|
|
DNS |
Shows the Cache and Host file tiles:
|
|
|
TCP connections
|
Returns a list of established TCP connections.
|
|
|
Listening ports
|
Returns a list of processes which are listening for network connections.
|
|
|
ARP Cache |
Returns a list of processes which are listening for network connections and also shows routing tables. |
|
|
WIFI
|
Shows a list of visible wifi networks, including basic network properties.
|
PatchInsights tab
|
Panel |
Description |
Data source |
|---|---|---|
|
Patch Status |
1E Patch Insights provides an overview of the last mile patching required on your environment. It is centered around the final stages of your monthly patching process, with a view to allow you to identify the problematic devices in your environment. At this point of its development, Patch Insights does not remediate the cause of patch failures, or the inability to reach devices, but it gives a view of these, and once manual remediation action has been taken, the ability exists within Patch Insights to redeploy the failed patches using the power of 1E.
|
|
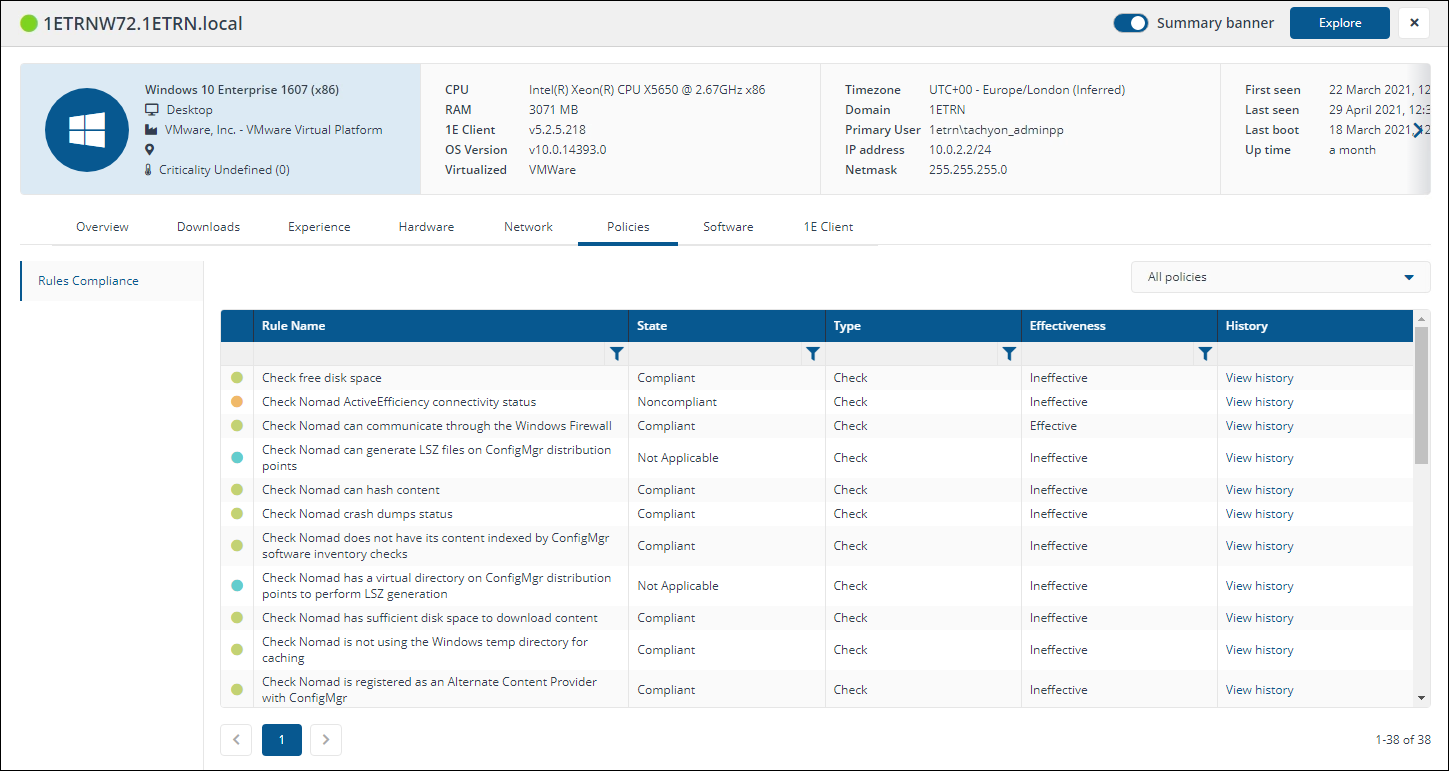
Policies tab
|
Panel |
Description |
Data source |
|---|---|---|
|
Rules Compliance |
Shows a list of the rules applied.
|
Data from Endpoint Automation |
|
Diagnostics |
Shows the diagnostic information about the policy applied (rules and event subscriptions) |
|
Software tab
|
Panel |
Description |
|
|---|---|---|
|
Normalized Software |
Shows a comprehensive list of all normalized software installed on this device.
|
|
|
All Software |
Shows a complete list of all software installed on the device, including unmatched software.
|
|
|
Installations |
Shows (per-device) installed software.
|
|
|
Windows Services
|
Shows list of installed Windows services and their current state. There are search and filter options available to find the Windows services from the available list. It also allows to export the data as a CSV file.
|
|
|
Environment Variables |
Shows operating system environment variables. |
|
|
Process History
|
Shows detailed information about all running processes. There are search and filter options available to find the process from the available list.
|
VDX tab
|
Panel |
Description |
Data source |
|---|---|---|
|
Details |
VDX session details. |
|
|
User Sessions |
VDX user sessions. |
1E Client tab
|
Panel |
Description |
Data source |
|---|---|---|
|
Binaries |
Shows a list of the binary files in the executable folder of the 1E Client.
|
|
|
Configuration file |
Shows the full content of the 1E Client configuration file, including:
|
|
|
Extensibility
|
Shows extensibility objects (modules and providers) loaded by the 1E Client.
|
|
|
Local Storage |
Shows Data Files and Client Inventory Database Use tiles that display the list of:
|
The Device View page requires the following feature-related DEX Packs that contain instructions used by the page.
|
DEX Pack name |
Instruction name |
Device View panel |
Readable Payload |
|---|---|---|---|
|
1E-Experience |
Experience\Application Interaction |
User interaction across applications |
|
|
1E-Experience |
1E-Experience-LogonSessions |
n/a |
Current user logon sessions |
|
1E-Experience |
Experience\User Interaction |
Get user interaction history over last 30 days |
|
|
1E-Nomad |
Downloads\Nomad Configuration |
Nomad Branch service settings |
|
|
1E-Tachyon-Platform |
1E Client\Binaries |
List deployed 1E Client binary files |
|
|
1E-Tachyon-Platform |
1E Client\Configuration File |
Show 1E Client configuration file content |
|
|
1E-Tachyon-Platform |
1E Client\Local Storage |
List 1E Client data files |
|
|
1E-Tachyon-Platform |
1E Client\Extensibility |
Show 1E Client extensibility (modules and providers) |
|
|
1E-Tachyon-Platform |
1E Client\Local Storage |
List of inventory database tables |
|
|
1E-Tachyon-Platform |
Hardware\Peripherals |
List of hardware devices |
|
|
1E-Tachyon-Platform |
Hardware\Disk Drives |
List disk drives |
|
|
1E-Tachyon-Platform |
Overview\Resource Usage |
Hardware resource usage over time |
|
|
1E-Tachyon-Platform |
Overview\Resource Usage |
Resource usage by executable for %minute% |
|
|
1E-Tachyon-Platform |
Network\ARP and Routing |
List entries in ARP cache |
|
|
1E-Tachyon-Platform |
Network\Throughput |
Network throughput for last 60 minutes |
|
|
1E-Tachyon-Platform |
Network\DNS |
DNS cache entries |
|
|
1E-Tachyon-Platform |
Network\DNS |
Host file content (for DNS overrides) |
|
|
1E-Tachyon-Platform |
Network\Interface configuration |
Network interface configuration |
|
|
1E-Tachyon-Platform |
Network\Listening ports |
Processes listening on TCP and UDP ports |
|
|
1E-Tachyon-Platform |
Network\ARP and Routing |
Routing table information |
|
|
1E-Tachyon-Platform |
Network\TCP connections |
Established TCP connections |
|
|
1E-Tachyon-Platform |
Network\WiFi |
List visible WiFi networks |
|
|
1E-Tachyon-Platform |
Software\Env. Vars |
List environment variables |
|
|
1E-Tachyon-Platform |
Software\Installations |
List software installations |
|
|
1E-Tachyon-Platform |
Software\Processes |
List running process details |
|
|
1E-Tachyon-Platform |
Software\Windows Services |
List Windows Services |